
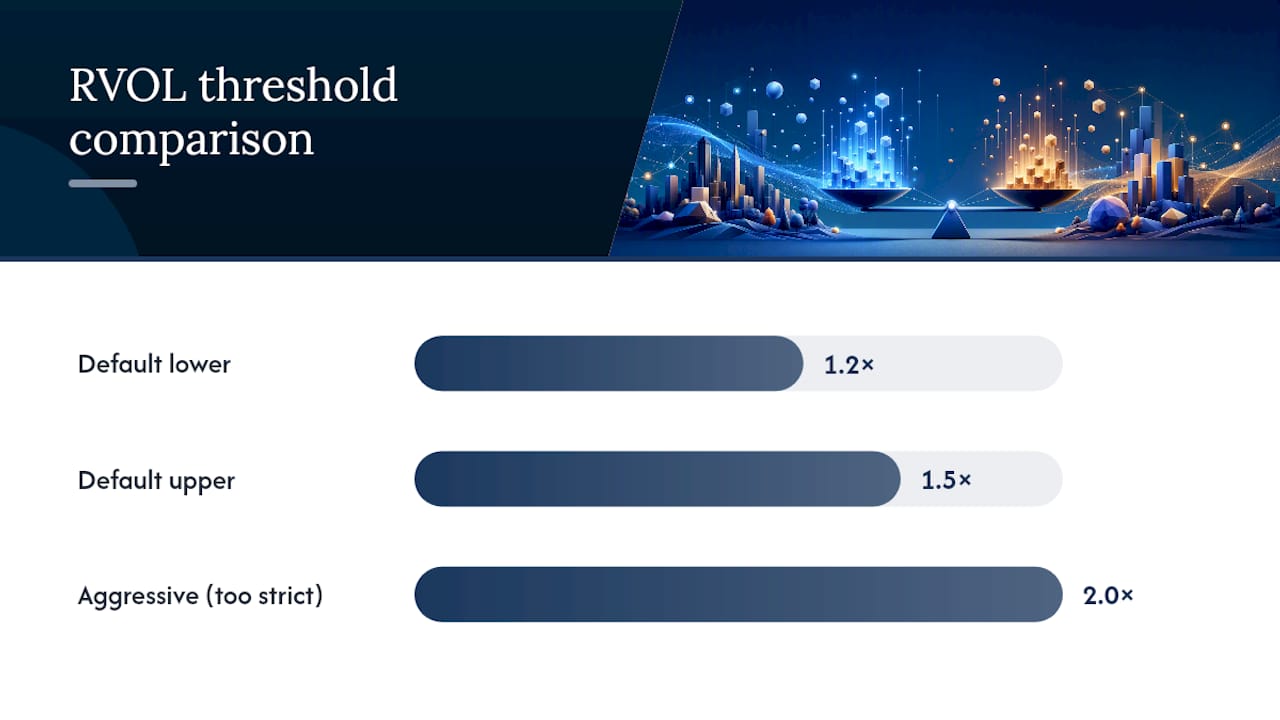
Yes, use a modest relative-volume threshold, roughly 1.2 to 1.5 times average volume, as a confirmation filter, not your primary signal. Backtests consistently show this range lifting profit factor without gutting your trade count, while anything past 2.0× tends to starve your sample size. Before you trust any threshold, run it through walk-forward validation and a realistic cost sweep.
TL;DR:
- Using a relative volume threshold of 1.2 to 1.5 times the average volume improves your strategy's profit factor without drastically reducing trade count, unlike higher thresholds.
- Always reference the previous bar's volume data when applying volume filters to avoid lookahead bias and ensure realistic backtest results.
- Thresholds above 1.5× decrease trade counts significantly and tend to produce unreliable profit metrics, making them unsuitable for actual trading.
- Rerunning volume threshold grids across different market regimes and asset classes reveals regime-dependent performance, emphasizing the need for specific calibration.
- Incorporating walk-forward validation, falsification tests, and realistic cost modeling is essential to verify that volume filters add genuine predictive value in live trading.
Table of Contents
- How to implement a volume-threshold filter in your backtest
- Choosing the right volume threshold without starving your sample
- Validation essentials: walk-forward, falsification, and cost sensitivity
- Which metrics actually tell you if the filter works
- A practical tuning workflow you can run every time
- How Trade4 supports practical volume-threshold backtests
- How volume filters affect execution and market impact
- Comparing volume thresholds across asset classes and conditions
- Combining volume thresholds with other filters and indicators
- Common pitfalls in volume threshold backtesting
- When volume thresholds help, and when they quietly don't
- Run these tests faster with the Trade4 Backtester
- Key sources and tools to reproduce the tests
How to implement a volume-threshold filter in your backtest
Start with relative volume (RVOL): current bar volume divided by a rolling simple moving average, typically 7 to 20 periods. That single ratio tells you whether "right now" is unusually active relative to recent history, which is more useful than a raw volume number that means nothing without context. Alternatives include VWAP-relative volume (comparing traded volume against a volume-weighted average price band) and absolute rolling averages, which work better for instruments with stable, non-seasonal volume patterns.
Where you apply the filter matters as much as how you calculate it. Always reference the previous bar's volume data when deciding whether to enter on the current bar. Using the same bar's volume to trigger the same bar's entry is lookahead bias, and it will inflate your backtest results in ways that never survive live trading.
A few implementation notes that save real debugging time:
- Build in a warm-up period equal to at least your longest lookback window before generating any signals, so your moving averages aren't computing off incomplete data.
- Check for NaN values explicitly after warm-up. Code like
if len(data) < max(window) + 1: returncatches this before it silently corrupts your results. - Match your volume window to your bar timeframe. A 7-period SMA on 1-minute bars behaves very differently than the same window on daily bars.
- For intraday strategies, account for the U-shaped volume curve. Volume near the open and close is naturally elevated, so a threshold calibrated on midday bars will fire constantly at 9:35 AM.
Reasonable starting defaults: volume_sma_window = 7, rvol_threshold = 1.2 to 1.5. These aren't arbitrary. Backtests using this exact window and threshold band consistently show meaningfully better selectivity than no filter at all, without collapsing sample size the way a 2.0× threshold often does.
Pro Tip: Log the raw RVOL value alongside every trade in your results, not just whether the filter passed or failed. When you review a losing streak later, you'll want to know if your threshold was barely clearing 1.2× or firing at 3.5×, since that tells you whether the problem is the filter or something else entirely.
Choosing the right volume threshold without starving your sample
Every threshold you add trades selectivity for sample size, and the relationship isn't linear. One published test on threshold sensitivity showed the pattern clearly: no volume filter produced 75 trades at a profit factor of 1.14. Raising the bar to 1.2× cut that to 54 trades but pushed profit factor to 1.63. At 1.5×, it dropped further to 29 trades with a profit factor of 1.89. Push to 2.0×, though, and the sample collapsed to just 10 trades with profit factor falling to 0.60, a sign you've crossed from "selective" into "statistically meaningless."
Statistic callout: A high relative volume threshold cut one strategy's trade count significantly while the profit factor deteriorated, illustrating how over-filtering destroys both sample size and edge.
That last data point is the one traders skip past. A profit factor above 1.5 on 10 trades tells you almost nothing about the future. You need a minimum trade count, generally in the low hundreds across your full test period, before you can treat any performance metric as more than noise.
Rather than picking whichever single threshold scored best in-sample, test a grid, something like 1.0×, 1.2×, 1.3×, 1.5×, 1.8×, 2.0×, and plot profit factor and expectancy against each value. Look for a plateau, a range where performance stays roughly stable across a few adjacent thresholds. A plateau suggests a real, durable effect. A sharp spike at one specific value usually means you've found noise, not signal.
- Run the same threshold grid across at least two distinct market regimes (trending vs. choppy) and two or more instruments before locking in a value.
- If your best threshold changes dramatically between regimes, the filter is regime-dependent, not universally useful, and you should say so in your documentation.
Validation essentials: walk-forward, falsification, and cost sensitivity
A threshold that looks great on your full historical dataset can fall apart the moment you split that data into pieces it hasn't seen. That's the entire point of walk-forward testing.
- Split your data into sequential folds, optimize your threshold on fold one, then test it unchanged on fold two. Roll forward and repeat across the full dataset, reporting per-fold metrics rather than one blended number.
- Run falsification tests: shuffle your entry timing (permutation), strip out the volume rule and test price action alone (ablation), and compare against fully random entries. If your volume-filtered strategy doesn't meaningfully outperform its randomized counterpart, the filter isn't adding value.
- Apply a cost sensitivity sweep. Layer in commissions, exchange fees, and slippage at multiple assumption levels, then rerun your threshold grid. Thin edges from a 1.2× filter often evaporate entirely once realistic costs enter the picture. Full slippage modeling matters more here than in almost any other part of the process.
- Bootstrap your trade list, resampling with replacement thousands of times, to generate confidence intervals for profit factor and expectancy rather than reporting a single point estimate.
Pro Tip: Run your cost sweep before you fall in love with a threshold, not after. A 1.5× filter that looks brilliant at zero commission can turn negative the moment you add a realistic per-share fee.
Which metrics actually tell you if the filter works
Your primary metric should be per-trade expectancy after costs: average win times win rate, minus average loss times loss rate, with commissions and slippage already deducted. Everything else is supplementary context.
- Profit factor (gross profit divided by gross loss) tells you the shape of your edge, but treat any PF calculated from fewer than 50 to 100 trades with real suspicion.
- Sharpe or Sortino ratio captures risk-adjusted return, useful for comparing threshold settings against each other.
- Win rate and max drawdown round out the picture, especially for gauging whether a higher threshold trades fewer, larger wins for a rougher equity curve.
- Bootstrap resampling (commonly 10,000 iterations on your trade list) gives you a confidence interval for both profit factor and expectancy, which is far more honest than a single point number.
Statistic callout: If your bootstrapped profit factor confidence interval contains 1.0, treat the strategy as unproven, regardless of how good the point estimate looks. That single red flag catches more overfit thresholds than any other check on this list.
A practical tuning workflow you can run every time
Skipping steps here is how traders end up trusting a threshold that only worked by accident. Follow the same sequence every time you test a new value.
- Verify data integrity first: check for gaps, split adjustments, and volume data that resets or double-counts around corporate actions.
- Confirm your warm-up period is long enough for every indicator in the strategy, not just the volume filter.
- Run your threshold grid in-sample, then walk it forward across untouched folds.
- Apply falsification tests and your cost sensitivity sweep.
- Bootstrap the surviving trade list for confidence intervals before drawing conclusions.
- Paper trade the final configuration for a defined window before committing real capital.
Keep a running log of every parameter sweep, including random seeds and the exact data range tested, with consistent file naming. Six months from now, you'll want to know exactly what produced a given equity curve, not just that it existed.
Pro Tip: Name your test runs with the threshold value and date baked into the filename (e.g., rvol15_2026Q1_walkforward.csv). It sounds trivial until you're trying to figure out which of twenty CSVs produced the chart you're staring at.
How Trade4 supports practical volume-threshold backtests
Running this entire workflow by hand, across multiple thresholds, folds, and cost assumptions, is where most traders quietly give up. Trade-4 was built around exactly this problem for small-cap traders who need granular control without writing custom infrastructure.
- No-code visual builders let you configure an RVOL or SMA-based volume filter and adjust the threshold without touching a line of code.
- Tick-accurate historical data, down to one-second bars, means your warm-up and alignment concerns are handled at the data layer.
- Same-day re-entry analytics show whether a volume-confirmed setup still holds up on subsequent re-entries within the same session.
- News tagging lets you separate volume spikes driven by catalysts from ordinary volatility, a distinction that matters enormously for small caps.
- Multi-strategy runs let you test your full threshold grid across instruments in parallel instead of one at a time.
A practical sequence: configure your RVOL filter, run the full threshold grid, layer in walk-forward validation, sweep your cost assumptions, and export the reports for your archive.
How volume filters affect execution and market impact
A volume-threshold filter changes more than which trades your backtest logs. It changes the liquidity profile of the trades you'd actually be entering.
Requiring elevated relative volume means you're systematically selecting for moments when a stock is already attracting outsized participation, which cuts both ways. On one hand, higher volume generally means tighter spreads and more available size at the top of the book, so your fills should track your backtested assumptions more closely than they would on a thin, low-volume entry. On the other hand, a volume spike often means other traders are reacting to the same catalyst you are, and you're competing for fills in a crowded moment rather than a quiet one.
This is where a lot of backtests quietly lie. A strategy that looks clean at 1.5× RVOL on paper can face real slippage once you're trying to execute size into a stock that's already seeing a volume surge, because that surge is often driven by other participants moving the same direction. Small-cap names are particularly exposed here since a 1.5× volume spike on a stock that normally trades 50,000 shares a day is a very different execution environment than a 1.5× spike on a heavily traded index constituent.
Model your slippage assumptions as a function of the threshold itself, not as a flat number across every trade. A filter set at 2.0× should carry a higher slippage assumption than one set at 1.2×, since the former is explicitly selecting for more chaotic, higher-participation moments. Ignoring this relationship is one of the most common ways backtested edges disappear in live execution.
Comparing volume thresholds across asset classes and conditions
Volume threshold backtesting doesn't transfer cleanly across markets, and treating it as a universal setting is one of the more expensive assumptions a trader can make. Liquid, large-cap indices and major forex pairs tend to show the most reproducible volume-confirmation effects, largely because their volume patterns are stable and seasonal (heavier at the open and close, lighter midday) in ways a model can learn and generalize.
Small-cap equities behave very differently. Daily volume on a thinly traded name can swing by an order of magnitude on no news at all, which means a threshold calibrated on 30 days of history might be meaningless in month two. Public backtests on volume-exhaustion and no-supply setups show the strongest, most reproducible signal concentrated in liquid US indices, while thin small-cap intraday setups without enough historical depth show far more fragile, regime-dependent results.
Crypto and commodities present their own wrinkle: 24-hour trading means "average volume" needs to account for time-of-day effects across multiple sessions, not just a single trading day. A volume SMA that ignores this will misfire constantly, flagging false spikes every time a new regional session opens.
The practical takeaway is to never assume a threshold validated on one asset class transfers to another. Rerun your full grid, walk-forward, and cost sweep independently for each instrument category you trade. A 1.3× RVOL threshold that produces a stable plateau on an index ETF may need to sit closer to 1.8× on a small-cap name simply because the baseline volume series is noisier to begin with.
Combining volume thresholds with other filters and indicators
Volume filters rarely work well alone. Standalone volume indicators generally show limited predictive power on their own, and the meaningful edge tends to show up when volume confirmation is layered with a trend or momentum rule rather than used in isolation.
A common combination pairs an RVOL threshold with a moving-average trend filter, only taking volume-confirmed signals that align with the broader trend direction. Another approach layers volume confirmation on top of a breakout or gap rule, using volume as the tiebreaker between a genuine breakout and a low-conviction fakeout. Time Segmented Volume and Volume RSI are two contextual indicators that have shown better results when combined with price or momentum filters than when used as a lone signal, particularly across S&P 500 backtests spanning multiple regimes.
The mechanical part matters here too. When you stack filters, test them incrementally rather than all at once. Add the volume filter to your baseline strategy and measure the change. Then add the trend filter and measure again. If you combine three or four filters simultaneously and only look at the final combined result, you have no way of knowing which filter is doing the work and which one is just adding noise or, worse, quietly canceling out another filter's benefit.
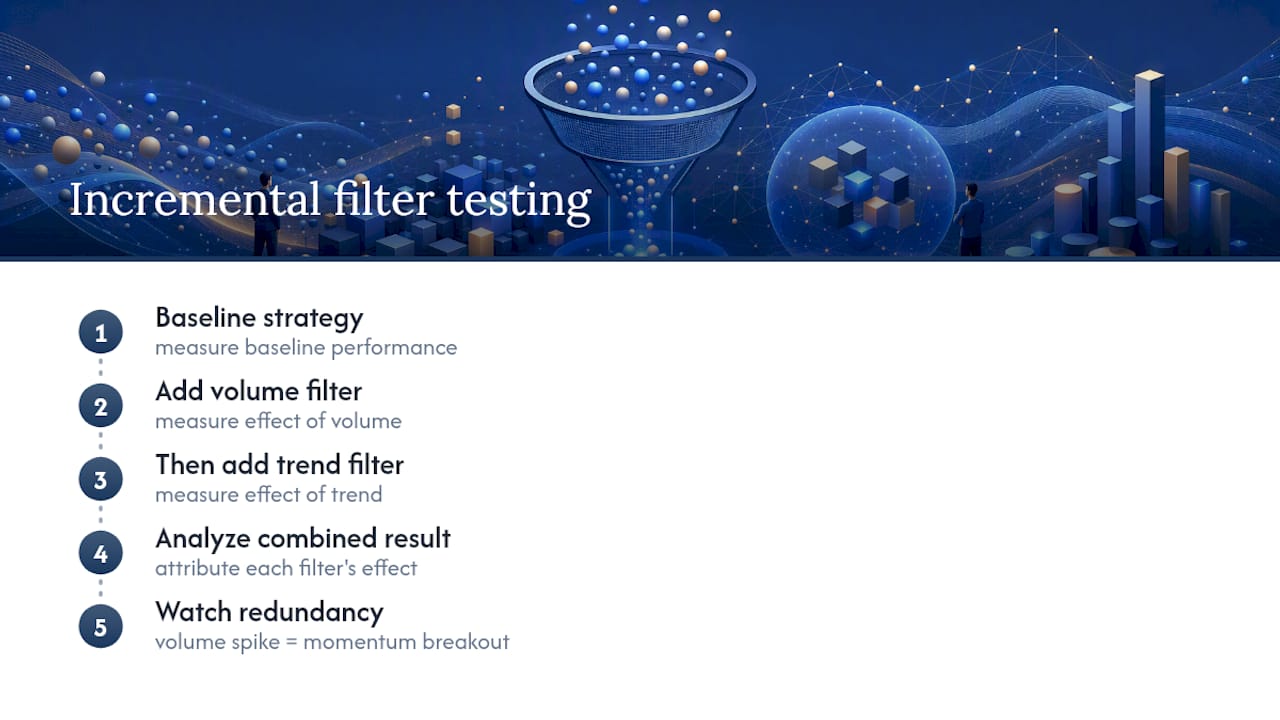
Watch for filter redundancy specifically. A volume spike and a momentum breakout often fire on the same bars for the same underlying reason, a sudden move in price and participation together. Stacking both doesn't necessarily add selectivity; it can just be measuring the same event twice while making your sample size smaller for no real gain.
Common pitfalls in volume threshold backtesting
The single most damaging mistake is in-sample optimization: testing dozens of threshold values on your full dataset, picking whichever one produced the best profit factor, and calling that your final parameter. This is how a 2.0× threshold with 10 trades and a profit factor of 1.89 gets mistaken for a discovery instead of noise, when a broader test would show that exact same setting collapsing performance elsewhere in the data.
Lookahead bias is the second recurring trap, using same-bar volume to justify a same-bar entry. It's an easy mistake to make in a spreadsheet or quick script, and it inflates results in a way that never shows up until you're live.
A third pitfall is ignoring regime dependence. A threshold tuned entirely on a trending bull market period will often fail outright in a choppy or declining market, because relative volume behaves differently when participants are fleeing a position versus chasing one.
Finally, watch for survivorship and data quality issues specific to volume: stock splits, halts, and low-float small caps can produce volume numbers that look like genuine spikes but are actually data artifacts. Mitigating all four requires the same discipline: walk-forward validation instead of single-pass optimization, strict previous-bar referencing, multi-regime testing, and a data integrity check before any threshold gets near your final report. None of these fixes are exotic. They're just steps traders skip when a backtest already looks good enough to stop questioning.
When volume thresholds help, and when they quietly don't
Volume confirmation earns its keep in liquid, high-volume markets where relative volume patterns are stable enough to mean something across multiple regimes. It tends to disappoint in thin small-cap intraday setups where there simply isn't enough historical depth to separate a genuine signal from noise.
The traders who get burned aren't using volume wrong so much as expecting too much from it. Pair it with a trend or regime filter rather than trusting it alone, and treat any standalone volume backtest with real skepticism regardless of how clean the profit factor looks. Volume confirms a thesis. It doesn't generate one, and strategies built as if it does tend to fail exactly when live volume stops behaving like the backtest.
— Romans
Run these tests faster with the Trade4 Backtester
Every step in this guide, the RVOL grid, the walk-forward folds, the cost sweep, the bootstrap confidence intervals, takes real engineering time to build from scratch. Trade4 gives small-cap traders a no-code way to run all of it without maintaining a local database or writing custom Python for every parameter change.

You configure your volume threshold and any combined filters through the visual pattern builder, run a full parameter sweep across your grid, and generate walk-forward and cost-sensitivity reports without touching code. Same-day re-entry analytics and news tagging let you separate a genuine volume-confirmed setup from a headline-driven fluke, something a generic backtesting script won't show you out of the box. If you're ready to test your own threshold assumptions against tick-accurate data, the getting started guide walks you through your first backtest, or you can go straight to the Trade4 Backtester and start building your first strategy today.
Key sources and tools to reproduce the tests
For hands-on reproduction, the pedrobraiti/volume-profile-trading repository on GitHub includes rolling composite profiles, walk-forward validation, and falsification tests you can adapt directly. PyQuantLab's writeup on relative volume spike momentum strategies walks through RVOL implementation with trailing stops. For deeper platform-specific guidance, see Trade-4's posts on walk-forward validation and slippage modeling, and watch for optimization bias creeping in through revenge trading style overcorrection after a losing sweep.