
Treat risk filters as portfolio-level gatekeepers, not signal-level afterthoughts, and validate them with a preserved out-of-sample holdout plus statistical robustness tests. Run walk-forward splits, check the Deflated Sharpe Ratio, and calculate the probability of backtest overfitting before you trust any drawdown improvement. Platforms like Trade-4 make this workflow repeatable because filters live as a separable layer you can toggle without regenerating signals.
TL;DR:
- Proper risk filters should be tested at the portfolio level with out-of-sample data, walk-forward splits, and statistical robustness tests to avoid overfitting.
- Filters applied inside signals change trade selection, while portfolio-level filters impact trade survival, which can distort metrics like win rate and drawdowns.
- Backtest pitfalls like over-optimization, look-ahead bias, and unrealistic execution assumptions can make filters seem more effective than they are in live trading.
- Validating filters requires logging experiment parameters, preserving an out-of-sample holdout, and running multiple walk-forward tests to ensure stability across regimes.
- A well-designed risk schema that is toggleable and separate from signal logic enables reliable, repeatable testing against live portfolio conditions.
Table of Contents
- What Are Risk Filters in Backtesting?
- Common Backtest Pitfalls That Distort Risk-Filter Assessment
- How Do You Test and Evaluate Risk Filters Properly?
- Which Statistical Tests Actually Validate a Filter?
- Building a Risk Schema You Can Actually Reuse
- What Traders Get Wrong About Risk Filters
- Run These Workflows Inside Trade-4
- Where to Go Deeper on Risk Filter Validation
What Are Risk Filters in Backtesting?
A risk filter is a rule that blocks or shrinks a trade before it enters your book, based on portfolio state rather than the signal itself. Common examples include a cap on concurrent positions, a symbol blacklist for illiquid tickers, an exposure ceiling by sector, and a volatility or time-of-day gate that mutes entries during the open ten minutes.
The distinction that trips up most traders: filters embedded inside signal logic behave differently than filters applied as a separate portfolio-level schema. A signal-level filter (say, "only take this setup if gap % exceeds 8") changes what counts as a trade candidate. A portfolio-level filter (say, "never hold more than four concurrent small-cap positions") changes how many candidates survive after they're generated, regardless of which strategy produced them.
That separation matters because it changes your metrics in different ways:
- Trade frequency drops when either filter type tightens, but portfolio-level filters drop it unevenly across strategies sharing the same capital pool.
- Exposure caps compress your equity curve's variance, often flattening drawdown at the cost of fewer total trades.
- Distributional metrics like win rate can shift even when the underlying edge hasn't changed, because the filter is selecting which trades survive, not improving the ones that do.
- Execution assumptions interact directly with filters: a symbol blacklist removes some of your worst slippage cases, which can make a filter look more effective than it will be once real fills replace backtest fills.
Common Backtest Pitfalls That Distort Risk-Filter Assessment
Backtesting gives you useful evidence, but it commonly suffers from over-optimization, look-ahead bias, and unrealistic execution assumptions. Each pitfall distorts risk-filter metrics in a specific, predictable direction.
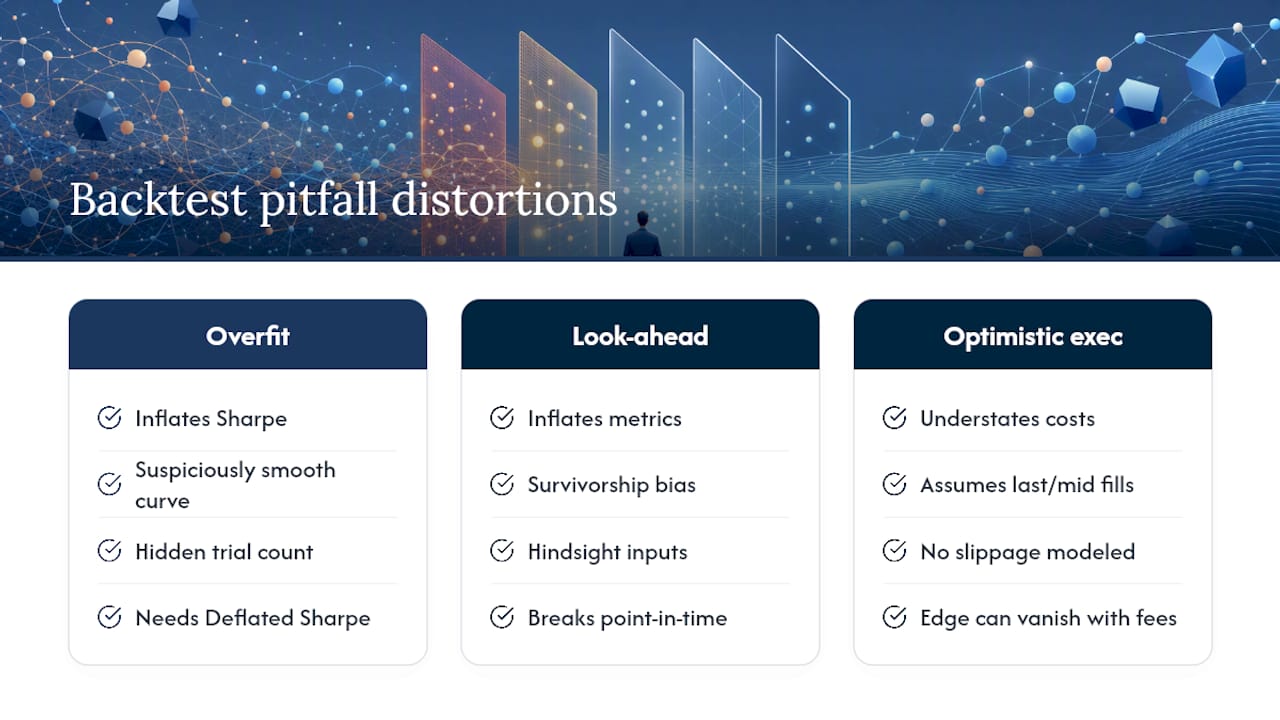
Overfitting and hidden trial counts. If you tested twelve versions of a concurrent-position cap before settling on "max four," your reported Sharpe ratio reflects the best of twelve draws, not one honest test. Most teams undercount their search space this way, and the correction (the Deflated Sharpe Ratio) needs the real trial count to mean anything.
Look-ahead and survivorship bias. A symbol blacklist built using knowledge of which small caps later got delisted or halted is not a filter, it's hindsight. Point-in-time data discipline matters as much for filter inputs as for signal inputs.
Optimistic execution assumptions. A filter that caps concurrent positions can look artificially strong if your backtest assumes fills at the last traded price with no slippage. Add realistic commissions and slippage, and the filter's apparent edge often shrinks, sometimes to nothing.
Small samples and regime dependency. A volatility gate tested only across a calm six-month window will look flawless and then fail the first time markets turn. Regime-conditional audits, splitting results by low, normal, and high EWMA volatility buckets, expose filters that only work when nothing goes wrong.
Statistical reality check: A backtest with a flawless equity curve and no drawdown is itself a warning sign of overfitting, not proof of a well-designed filter. The literature on backtest overfitting treats a suspiciously smooth result as evidence to investigate, not to celebrate.
How Do You Test and Evaluate Risk Filters Properly?
A reproducible framework separates "does this filter work" from "did I get lucky finding it." Here's the sequence that holds up under scrutiny.
- Log the experiment before you touch results. Record data version, code commit, every parameter value tested, the date range, and your cost assumptions. This single habit prevents the most common failure: forgetting a discarded variant that quietly inflated your reported performance.
- Preserve an untouched out-of-sample holdout. Split your data once, lock the OOS segment away, and don't peek at it while you tune the filter on the in-sample portion.
- Run rolling walk-forward splits on top of that. A single OOS test tells you about one slice of history. Walk-forward testing rolls the training window forward repeatedly, giving you a distribution of OOS hit rates instead of one lucky (or unlucky) number.
- Re-run the filter layer separately from signal generation. If your risk filters live in a separate schema rather than hardcoded into signal logic, you can persist your signals (time, symbol, entry price, intended size) once and re-run only the filter-gating step against different rule sets. This is far faster than regenerating signals from scratch every time you tweak a threshold.
- Collect filter-specific metrics, not just headline returns. Track conditional drawdown (drawdown only on filtered trades), exposure percentiles across the equity curve, win/loss streak length, and the filter's effect on turnover.
When you present results, show gross and net side by side, list your assumptions in a table, and lead with the summary statistics that matter for deployment decisions:
- Trades rejected by the filter and the stated reason for each rejection.
- OOS hit rate across walk-forward windows, not just the single best window.
- Net Sharpe after realistic costs, alongside the raw signal Sharpe for comparison.
- Maximum drawdown with and without the filter active, on the same data slice.
Which Statistical Tests Actually Validate a Filter?
Four diagnostics separate a filter that works from one that got lucky in your search.
- Deflated Sharpe Ratio (DSR) corrects the observed Sharpe ratio for the number of trials you ran, along with skewness and autocorrelation in returns. If you tested twelve parameter variants, DSR needs to know that, not just the winning one.
- Probability of backtest overfitting (PBO), often computed through combinatorially purged cross-validation (CPCV), estimates the odds that your chosen filter setting is a rank-ordering artifact of the search process rather than a genuine effect.
- Monte Carlo permutation or shuffle tests reshuffle trade order or returns to generate a null distribution, then rank your observed metric against it. If your filter's Sharpe sits comfortably inside the shuffled distribution, it isn't adding anything real.
- Walk-forward OOS hit rate combined with regime-conditional audits tell you whether the filter holds up across calm and turbulent periods, not just on average.
A number worth remembering: when counting trials for a DSR calculation, every distinct parameter set and strategy variant that influenced your final choice counts, including the ones you rejected. Skipping those undercounts the search space and biases the correction toward false confidence.
Turning these into a decision rule helps more than staring at raw statistics. A practical operational framework looks like this:
- PASS: DSR stays comfortably positive after correction, PBO sits below roughly 0.3, and the filter's OOS hit rate holds across at least three walk-forward windows and two volatility regimes.
- WARN: DSR is marginal, PBO sits in a gray zone, or performance concentrates in one regime. Treat this as "needs more data or a simpler rule," not a green light.
- FAIL: The observed metric falls inside the Monte Carlo null distribution, or OOS hit rate collapses outside the in-sample window. Discard the filter setting and revisit the search process itself.
Backtest-audit style tooling that returns a continuous risk score alongside a PASS/WARN/FAIL verdict is genuinely useful here, mainly because it forces a consistent threshold instead of a gut call made section by section.
Building a Risk Schema You Can Actually Reuse
A risk schema is a portfolio-level object with a name, an array of validation functions, and optional callbacks, and it checks proposed trades against live portfolio state (active position count, current holdings) before a signal becomes a trade. Design it as a layer sitting outside your signal logic, and you gain the ability to toggle constraints on and off without re-running strategy discovery.
Here's the implementation sequence that keeps this maintainable:
- Define each validation as its own function: max concurrent positions, symbol locks, sector exposure caps, and time-window gates each get their own check rather than one tangled conditional block.
- Store rejected signals with a reason code, not just a silent drop. A log of "rejected: concurrent position limit" versus "rejected: symbol blacklist" turns debugging into a five-minute task instead of a day of guesswork.
- Persist portfolio state between checks so validations can reference activePositionCount and activePositions without recalculating from scratch on every bar.
- Run parameter neighborhood tests around your chosen threshold (four concurrent positions, plus test three and five) to confirm the result isn't a knife-edge peak that a real-world week would knock over.
- Keep your OOS holdout untouched through every one of these iterations, and only re-run the filter layer against persisted signals rather than regenerating the whole backtest each time.
Pro Tip: Persist your raw signals once (timestamp, symbol, entry price, intended size), then treat filter testing as a separate replay step. You'll cut iteration time dramatically and get a cleaner A/B comparison between filter versions, because both are being tested against the exact same signal set.
A reasonable default: don't trust a filter's statistics with fewer than roughly 100 to 150 trades in the OOS segment, and expect wider confidence intervals below that.
What Traders Get Wrong About Risk Filters
Most traders treat risk filters as a tuning knob for the equity curve. Tighten the concurrent-position cap, watch drawdown shrink, ship it. That instinct is exactly backward. A filter's job is to survive contact with a regime you haven't seen yet, and a knob that only looks good on the data you tuned it against is a liability wearing a good Sharpe ratio.

The conventional advice, "just add more filters until the curve looks clean," ignores that every filter you test is another trial your Deflated Sharpe Ratio needs to know about. A flawless-looking backtest after six rounds of filter tweaking isn't a sign you found the right rule. It's usually a sign you found the rule your search process was most likely to hand you by chance.
What deserves priority instead: preserve your OOS holdout religiously, log every parameter variant you touch, and prefer the simple filter that survives a parameter neighborhood test over the tuned one that peaks sharply and falls off a cliff on either side. A concurrent-position cap of four that performs almost as well at three and five is a real rule. One that only works at exactly four is a coincidence with good marketing.
— Romans
Run These Workflows Inside Trade-4
Building this workflow from scratch means stitching together a signal engine, a separate risk-gating layer, and a logging system that survives a dozen parameter sweeps without losing track of what you tested. Trade-4's no-code risk-schema builder handles that stitching for you, letting you define concurrent-position caps, symbol locks, and exposure gates as toggleable rules you can turn on and off against the same signal set.

Because Trade-4 runs on tick-accurate historical data down to one-second granularity, your filter tests reflect real intraday behavior rather than smoothed daily bars that hide the slippage a fast small-cap gap actually produces. Rejected-signal logs show you exactly which filter blocked which trade and why, so debugging a filter's effect on your win rate takes minutes instead of a spreadsheet archaeology project. Same-day re-entry analytics let you see how a concurrent-position cap interacts with re-entry setups specifically, a detail most general backtesting tools never surface. If you're ready to test a portfolio-level filter against your own strategy history, get started with a free trial or check the subscription tiers to see which plan matches your data range and job queue needs.
Where to Go Deeper on Risk Filter Validation
- Read a full walkthrough on backtesting a strategy step by step for the mechanics behind OOS splits and cost modeling.
- See filters applied to real setups in the gap short strategy backtest guide.
- Browse the Trade4 blog for ongoing coverage of validation techniques and small-cap strategy design.