
Penny stock backtesting means testing a rules-based trading plan against historical microcap data. Done right, it tells you whether a strategy is genuinely tradeable. Done wrong, with idealized fills and fixed slippage assumptions, it manufactures profits that vanish the moment you go live. The one rule that matters more than any other: model execution realism first, including liquidity, fills, and slippage. If you're not ready to build that into a full test yet, start with a small paper-trading run or try a no-code microcap backtester built for this exact problem.
TL;DR:
- Penny stock backtests must include realistic modeling of liquidity, bid-ask spreads, and slippage that scales with order size and market conditions.
- Incorporating delisted and bankrupt tickers, along with gaps in data, prevents overestimating strategy performance caused by survivorship bias.
- Using fine-grained, point-in-time data and multiple slippage scenarios helps accurately assess realistic fill assumptions and execution costs.
- Performance metrics should include risk-adjusted measures like maximum drawdown and Sharpe ratio, tested across different market regimes.
- Initial testing should involve strict universe filtering, predefined rules, size caps relative to dollar volume, and a staged live deployment to manage execution risks.
Table of Contents
- Why Penny Stocks Need a Different Backtesting Approach
- Step-by-Step Backtesting Workflow Tailored to Penny Stocks
- Execution Realism: Modeling Slippage, Fills, and Liquidity for Microcaps
- Data and Tools: What You Actually Need to Test Microcaps Properly
- Trade4's Practitioner View: Testing Features Built for Microcap Reality
- Getting Started: A Compact Checklist and First Backtest Plan
- Romans' Perspective: Three Rules I Enforce Before Any Strategy Goes Live
- Try Trade4 for Realistic Penny Stock Backtesting
- Authoritative Sources and Further Reading
Why Penny Stocks Need a Different Backtesting Approach
Most backtesting frameworks were built for large-cap equities, where you can assume you get filled at the price you see and the stock will still be trading next year. Neither assumption holds for penny stocks, which comprise a broad universe of low-priced stocks under $5 a share, many on over-the-counter markets, where volume can evaporate unexpectedly and disclosure requirements are thinner than what large-cap traders take for granted.
That structural difference changes how you have to build every part of your test.
- Liquidity and sparse prints distort fills. A stock trading 50,000 shares a day doesn't behave like one trading 5 million. Your backtest needs to know the actual dollar volume in each bar, not just assume you got in at the close.
- Bid-ask spreads eat into returns fast. Penny stocks routinely carry spreads of several percent of share price. Brokers are required to disclose these spreads and any markups because they materially change what you actually realize on a trade.
- Survivorship bias inflates historical performance. If your data feed drops delisted or bankrupt tickers, your backtest only sees the survivors. That skews win rates and average returns upward in ways that have nothing to do with your strategy's real edge.
- Next-open fill assumptions are usually wrong. A large-cap stock might absorb your order without moving. A microcap with thin morning liquidity often gaps hard on the open, and assuming you got filled at that printed price is one of the fastest ways to build an illusory edge.
- Data completeness varies by issuer. Because penny stocks face lighter disclosure rules, some data feeds have gaps around earnings, dilution events, or reverse splits that a large-cap dataset would never have.
None of this means penny stocks are unbacktestable. It means the standard playbook, built for S&P 500 constituents with deep order books, needs real modifications before you trust a single equity curve it produces.
Step-by-Step Backtesting Workflow Tailored to Penny Stocks
Here's the sequence that separates a backtest you can trust from one that just looks good on a chart.
- Write the rule set with zero ambiguity. "Buy on a breakout" isn't a rule. "Buy when price crosses above the prior 20-bar high with volume at least 2x the 10-bar average, on a 1-minute chart" is. Every entry, exit, and invalidation condition needs a number attached, or your backtest engine will fill in the gaps with assumptions you never agreed to.
- Rebuild your universe to include dead tickers. Pull delisted, bankrupt, and reverse-split names into your dataset alongside active tickers. Skipping this step is the single fastest way to inflate a win rate that won't hold up live.
- Pick bar granularity that matches your strategy's speed. A swing strategy holding for days can run fine on daily bars. A gap-and-fade strategy that enters within the first five minutes of the open needs 1-minute or even 1-second bars, plus point-in-time data that reflects what was actually knowable at that moment, not restated after the fact.
- Configure order types, position sizing, and a variable slippage model. Don't hardcode a flat slippage percentage across every trade. Slippage should scale with your order size relative to the bar's dollar volume, along with time of day and recent volatility.
- Reserve an out-of-sample window before you optimize anything. A common split is 60% of your data for building and tuning the strategy, 40% held back and untouched until the rules are locked. Then run walk-forward optimization, re-fitting parameters on rolling windows and testing forward, to see whether the edge survives shifting market regimes instead of just fitting one lucky stretch of history.
- Track a standard metric set and build a dashboard you actually look at. CAGR and win rate alone tell you almost nothing about risk. Pair them with maximum drawdown, Sharpe or Sortino ratio, and expectancy per trade, then plot the equity curve against each regime (bull, bear, low-liquidity weeks) so you can see where the strategy actually earns its return.
Pro Tip: Run your walk-forward windows separately across bull markets, bear markets, and low-liquidity weeks. An edge that only shows up in one regime isn't an edge, it's a coincidence with good marketing.
Most traders skip step 2 and step 5 because they're inconvenient. Do it anyway. A strategy that only looks profitable because you tested it exclusively on survivors and tuned every parameter on the full dataset isn't a strategy. It's a backwards-looking story that happens to fit the data you already had.
Running a full year of weekly backtest campaigns on dedicated tools typically takes a moderate amount of time depending on data granularity and server load, so budget your iteration cycles accordingly if you're testing multiple strategy variants in a single sitting.
If you want a full procedural walk-through of this sequence with screenshots and setup examples, the step-by-step backtesting guide covers the same six steps in platform detail.
Execution Realism: Modeling Slippage, Fills, and Liquidity for Microcaps
Fixed slippage assumptions are the most common way penny stock backtests lie to you. A 0.1% slippage haircut might be realistic for a large-cap stock trading millions of shares daily. Apply that same number to a thinly traded microcap and your backtest will show profits that simply don't exist once you try to execute at scale.

The fix is to model slippage as a nonlinear function of participation rate (your order size relative to the bar's dollar volume), time of day, and recent volatility, rather than a static percentage applied uniformly across every trade.
Rough tiers to work from:
- Under 1% of bar dollar volume: fills tend to be close to the quoted price, with modest slippage.
- 1% to 5% of bar dollar volume: expect meaningfully worse fills, especially in the first and last 30 minutes of the session when spreads widen.
- Above 5% of bar dollar volume: impact rises sharply and non-linearly. Practitioner guidance treats this threshold as a breakpoint where your own order starts moving the price against you.
Size beyond that and you're not testing a strategy anymore, you're testing a fantasy where your order has no market impact.
Limit and market orders need separate treatment, too. Market orders should carry immediate impact proportional to your participation rate; you're taking liquidity, so you pay for it. Limit orders need a fill probability model based on recent prints and relative volume, because plenty of limit orders on illiquid names simply never fill, and a backtest that assumes every limit order executes is quietly overstating your edge.
Two more constraints belong in any serious microcap test:
- Hard-to-borrow limits on short strategies. A short pattern that looks great historically can be untradeable in practice because shares are unavailable to borrow or carry punishing borrow fees. Model that constraint explicitly, or your short-side backtest is fiction.
- Halts and gaps under stress testing. Run Monte Carlo simulations that randomize slippage and inject latency shocks, trading halts, and dilution events. If your strategy's P&L collapses under degraded execution scenarios, you've found the ceiling on how much capital you can safely deploy.
For a deeper dive on modeling spread and slippage specifically for short setups, the gap short strategy backtesting guide walks through the mechanics in more detail. Readers looking for a broader view on execution-cost modeling in fast-moving markets may also find the execution-cost concepts covered by Snipethem useful as a comparison point from a different corner of active trading.
Data and Tools: What You Actually Need to Test Microcaps Properly
Your backtest is only as honest as the data feeding it. For penny stocks, that means sourcing several data types most large-cap traders never think about.
Essential data categories:
- Minute or tick-level bars, depending on how fast your strategy trades.
- Actual prints and quotes, not just bar summaries, so you can see the spread you'd have actually faced.
- Point-in-time series that reflect only what was knowable at each moment, with no lookahead from restated data.
- Corporate-action adjustments for splits, reverse splits, and dilution events.
- Delisting records so dead tickers stay in your universe instead of quietly disappearing.
- News timestamps synced precisely to your decision windows, since a headline that hits three minutes after your entry signal shouldn't be allowed to influence that signal in your backtest.
Quality checks worth running before you trust any dataset: strip bad ticks and duplicate prints, confirm split adjustments were applied correctly, verify news timestamps actually align with trading decision windows, and confirm delisted tickers are present, not silently dropped.
On tool selection, you're generally choosing between three categories. No-code backtesters built specifically for microcap and small-cap patterns give you visual strategy builders and granular fill modeling without writing a line of code. Research platforms with tick and minute-level historical data suit traders who want raw access and plan to build their own analysis layer. Python frameworks using libraries like pandas and NumPy give you full control if you're comfortable coding your own execution model, walk-forward loop, and metrics calculations from scratch.
Choosing between minute and tick data comes down to how sensitive your strategy is to intrabar movement. A strategy that enters on a breakout confirmed at bar close can usually run fine on 1-minute bars. A strategy that reacts within seconds of a print, common in gap-and-fade or halt-resumption setups, needs tick or 1-second granularity or your fills will be systematically too optimistic.
Trade4's Practitioner View: Testing Features Built for Microcap Reality
A backtesting platform built for S&P 500 names will get you nowhere on a $0.80 OTC stock. Trade4 was built around the opposite assumption: that the fill quality, spread behavior, and liquidity constraints unique to small-cap and penny stock trading deserve their own testing environment, not a large-cap tool retrofitted with a lower price filter.
The feature set maps directly onto the realism gaps covered above:
- Bar granularity from 1 minute down to 1 second, so gap-and-fade or halt-resumption strategies aren't tested on data too coarse to capture what actually happened.
- News tagging and a news analyzer, letting you sync headline timing to your decision windows instead of guessing whether a catalyst preceded or followed your signal.
- Same-day re-entry analytics, useful for traders who scale in and out of a name multiple times in a session and need to see how each re-entry performed independently.
- Configurable slippage and participation-rate filters, so you can enforce the same order-size caps and tiered slippage models covered earlier in this guide, directly inside the platform, without building the math yourself.
That single configuration touches four of the realism problems that sink most amateur penny stock backtests.
Pro Tip: Before scaling any strategy past a handful of test trades, run it once with an aggressive slippage assumption and once with a conservative one. If the strategy only survives under the optimistic version, it's not ready for live capital.
If you're ready to move from theory to a running test, the minimal-first-test plan below gives you the exact parameters to start with inside Trade4.
Getting Started: A Compact Checklist and First Backtest Plan
Before you open any backtesting tool, confirm you have these six things in place:
- Point-in-time data covering your universe, including delisted tickers.
- A defined universe, filtered by price and minimum volume (filtering for volume above 10,000 shares is a reasonable starting screen).
- A precise rule spec with exact entry, exit, and invalidation conditions.
- Position size limits capped relative to bar dollar volume, not a flat share count.
- At least three slippage scenarios: optimistic, realistic, and pessimistic.
- A walk-forward setup with a defined in-sample and out-of-sample split.
A concrete first test to run: a momentum breakout strategy on 1-minute bars, entering when price breaks the prior 20-bar high on 2x average volume, exiting on a fixed percentage stop or time-based exit.
| Test parameter | Recommended starting value |
|---|---|
| Bar granularity | 1-minute |
| Universe filter | Price under $5, volume above 10,000 shares |
| Slippage scenarios | 0.1%, —, — |
| In-sample / out-of-sample split | 60% / 40% |
| Max order size | 5% to 10% of bar dollar volume |
| Paper-trade monitoring window | 4 to 6 weeks minimum |
Once your backtest clears validation, don't jump straight to live capital. Paper-trade the exact rule set for at least four to six weeks and compare actual fills against your backtest's slippage assumptions. If real fills consistently run worse than your "realistic" scenario, that's your signal to tighten the model before risking real money.
Romans' Perspective: Three Rules I Enforce Before Any Strategy Goes Live
The surprises never come from the strategy logic. They come from the fills. I've seen backtests with beautiful equity curves fall apart in paper trading purely because limit orders on thin names simply didn't fill, over and over, in ways the backtest never accounted for.
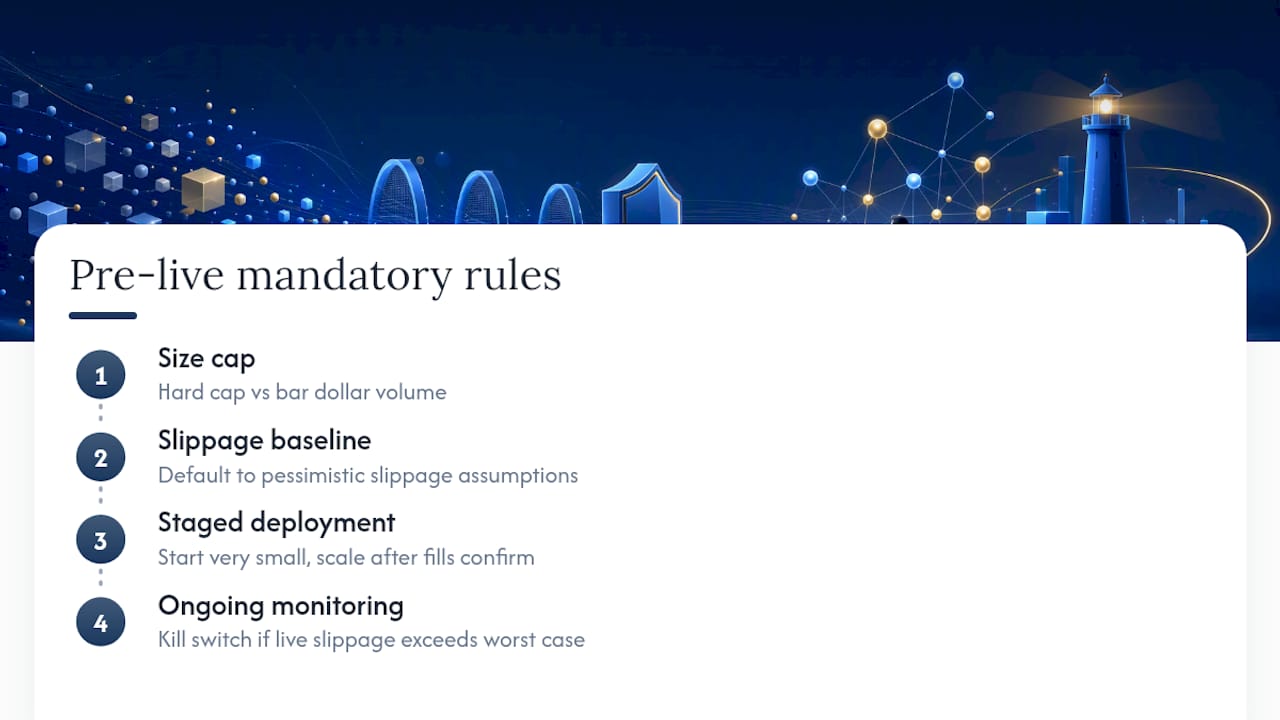
Three rules get enforced without exception before anything moves to live capital. First, a hard size cap relative to bar dollar volume, no exceptions for a strategy that "looks too good to skip." Second, a pessimistic slippage baseline as the default assumption, not the optimistic one, because optimistic is how good backtests become bad live accounts. Third, staged deployment: a small size for the first few weeks live, scaling only after real fills confirm the backtest's assumptions held.
None of that replaces ongoing monitoring. A strategy that worked for three months can stop working the moment liquidity in that ticker dries up, and a kill switch that pulls the strategy the instant live slippage exceeds your worst backtested case is the cheapest insurance you'll ever buy.
— Romans
Try Trade4 for Realistic Penny Stock Backtesting
Building your own slippage models, point-in-time data pipeline, and walk-forward loop in Python is possible, but it's weeks of infrastructure work before you run a single meaningful test. Trade4 gives you that same execution-realism rigor, tiered slippage, participation-rate caps, news-synced timing, and same-day re-entry analytics, through a no-code visual builder, so your first realistic backtest runs in an afternoon instead of a month.

Start by running the momentum breakout example from this guide inside the platform: set your universe filter, apply the three slippage scenarios, and compare your paper fills against the backtest output. If the numbers hold up, you'll know quickly whether a strategy deserves real capital or needs more work first. Check the Trade4 pricing tiers to see which plan matches your data history and bar granularity needs, or head to getting started to configure your first test today. For a broader grounding in trading risk management before you scale up size, the Stock Market Mastery guide on swing trading and risk is worth a read alongside your first few live weeks.
Authoritative Sources and Further Reading
- SEC guidance on penny stock definitions, disclosure rules, and market characteristics
- Practitioner frameworks on realistic penny-stock bot backtesting, slippage modeling, and stress testing