
Always model commissions in your backtest, and match the model to your broker's fee structure and your strategy's turnover. Use a per-share model for high-frequency US equity strategies, per-contract for futures, and flat per-trade or percentage models for lower-frequency, discretionary setups. Layer in spread and slippage wherever they meaningfully affect P&L, then run a sensitivity test with real broker inputs before you trust any equity curve.
TL;DR:
- Proper commission modeling should include spread, slippage, and exchange fees, not just base broker rates, especially for high-frequency strategies.
- The choice of commission model type must match your strategy's frequency and trade size, with per-share for scalping and flat per-trade for low-frequency trading.
- Small trade sizes can be disproportionately affected by minimum fees, making sensitivity analysis crucial to understand true costs.
- Validating your model against real broker data and live fills helps avoid underestimating actual trading costs, which can erode or eliminate strategy profitability.
- Use tools like Trade-4 to run fast, tick-accurate cost sensitivity tests and ensure your backtest accurately reflects real-world friction.
Table of Contents
- What Is a Commission Modeling Backtest?
- Commission Model Types and When to Use Each
- How Do You Calculate Breakeven Cost Per Trade?
- Implementing Commission Models in Your Backtest Engine
- Testing Commission Sensitivity Against Live Fills
- What Traders Consistently Get Wrong About Commission Modeling
- Run Your Own Cost-Sensitivity Test on Trade-4
- Key Docs and Studies to Consult
What Is a Commission Modeling Backtest?
A commission modeling backtest is a strategy simulation that applies your broker's actual fee structure, along with spread and slippage, to every trade instead of testing on frictionless fills. Skip this step and your Sharpe ratio, drawdown, and win rate are all measuring a strategy that doesn't exist. You're not backtesting your strategy; you're backtesting a fantasy version of it that never pays a fee.
The gap between gross and net performance is rarely trivial. Practitioner analysis of active trading costs finds that the true cost of a trade often runs two to three times the visible commission line once spread and swap costs get included. For a strategy trading hundreds of times a month, that difference can turn a profitable backtest into a strategy that bleeds money live.
Three things make commission modeling non-optional for serious quants. First, breakeven shifts: every fee moves your required exit price further from entry, and that shift compounds across hundreds of trades. Second, scalper sensitivity: strategies with tight profit targets get hit hardest, because a $0.005 per-share fee that looks trivial on a $50 stock can eat 20% of a $0.025 average profit target. Third, hidden fees: exchange pass-throughs, regulatory fees, and FX conversion markups rarely show up on a broker's marketing page but show up in your fill confirmations every time.
Commission Model Types and When to Use Each
Backtest engines typically expose five commission structures, and picking the wrong one for your strategy class is one of the most common backtest errors quants make. Documentation from cost-modeling frameworks like RustyBT recommends composing a full cost stack rather than relying on commission alone: commission plus spread plus slippage plus exchange fees, all applied per fill.
Here's how the five model types map to strategy class:
- Per-share: Typically at a few mills per share with a minimum fee at discount US brokers. This model dominates cost for high-turnover equity strategies, since the minimum fee structure means small orders get punished disproportionately relative to their size.
- Per-trade (flat fee): Runs several dollars per trade at traditional brokers. Flat fees win for low-frequency or discretionary strategies where you're placing a handful of trades a week, because the fee doesn't scale with position size.
- Per-contract: Futures and FX brokers typically charge under a few dollars per contract. Map this directly to lot size in your backtest engine rather than translating it into a per-share equivalent, which introduces rounding errors.
- Percentage/bps and tiered pricing: Common for institutional or negotiated pricing, where your effective rate drops as monthly volume crosses defined tiers. Model this as a lookup table keyed to trailing 30-day volume, not a static percentage.
- Maker-taker and rebates: Exchanges pay rebates for adding liquidity (maker fills) and charge fees for removing it (taker fills). If your backtest doesn't track fill-level maker/taker flags, approximate the net effect using an average rebate weighted by your expected maker/taker ratio.
Whatever model you choose, don't stop at the base rate. Broker fee studies have found that many "zero-spread" or "commission-free" brokers recover margin through FX conversion markups or per-trade fees buried outside the headline pricing. Always total the full round-trip cost, including exchange pass-through fees and regulatory charges like the SEC transaction fee on US equity sells, before you call your commission model complete.
How Do You Calculate Breakeven Cost Per Trade?
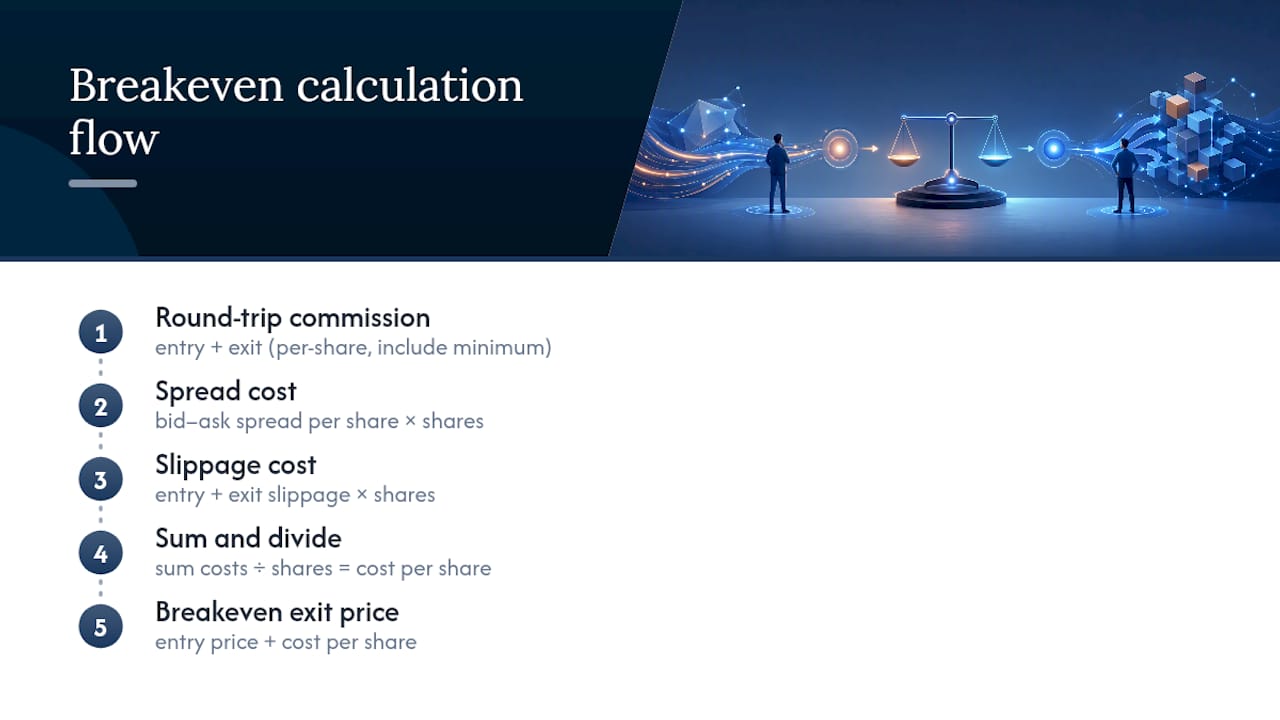
Breakeven exit price equals entry price plus cost per share, and cost per share equals total round-trip cost divided by shares traded. That's the whole formula. The complexity lives in getting each cost component right.
Round-trip commission total is entry commission plus exit commission. Spread cost is the bid-ask spread per share multiplied by shares traded. Slippage cost is entry slippage plus exit slippage, again multiplied by shares. Add those three together and divide by share count to get your true cost per share, then add that to your entry price to find the exit price where you stop losing money.
Here's a worked example. Say you buy 1,000 shares of a small-cap stock at $10.00 using a typical per-share commission with a minimum, a small spread, and slippage on each side of the trade.
Breakeven exit price equals entry price plus cost per share.
Pro Tip: Run this same math on a 100-share position instead of 1,000, and watch the $1 minimum commission dominate. At 100 shares, that $1 minimum on each side becomes $2 out of a much smaller cost base, pushing your cost per share to roughly $0.06, higher than the 1,000 share example despite the smaller trade.
That non-linearity is exactly why fixed minimums deserve their own line in your model. Position size and cost per share don't scale together once a minimum fee kicks in, and small-cap traders running sub-500 share positions feel that distortion the most.
Implementing Commission Models in Your Backtest Engine
Most backtest engines, whether you're working in a Python framework or a no-code visual builder, expect commission logic expressed as a small set of config fields rather than custom code for every run. Getting the field names and composition order right saves you from silently wrong results.
- Define the base rate and minimum. A typical config field set looks like
commission_type: per_share,rate: 0.005,minimum: 1.00. For tiered models, replace the flat rate with a lookup table keyed to trailing volume, for example{tier_1: 0.005 at <10k shares/month, tier_2: 0.003 at 10k-50k}. - Layer spread as a separate cost input. Express spread in basis points or a fixed per-share value, applied independently of commission so you can toggle it off in isolation during sensitivity tests.
- Add a slippage model. Whether it's a fixed value, a percentage of the average true range, or a volume-participation model, slippage should compose on top of spread and commission, not replace either.
- Include exchange and regulatory fees as a fourth layer. These are usually small and fixed, but they still belong in the stack since they show up on real fill confirmations.
- Handle partial fills and intrabar execution explicitly. If an order fills across multiple price levels within a bar, commission and spread should apply to each partial fill separately, not to the blended average, or your cost per share will understate true friction.
- Align timestamps between your fee model and your fill data. A commission or fee schedule that updates monthly needs to be applied using the fill's actual timestamp, not the backtest's run date, especially when testing over multi-year histories.
A simplified YAML pattern for a composed cost stack might read something like:
commission:
  type: per_share
  rate: 0.005
  minimum: 1.00
spread:
  type: fixed_bps
  value: 5
slippage:
  type: volume_participation
  max_participation: 0.10
exchange_fees:
  type: fixed
  value: 0.0000221  # per dollar, SEC-style fee
The exact field names will differ across engines, but the composition logic (commission, then spread, then slippage, then exchange fees, applied in that order to every fill) transfers cleanly whether you're scripting it in Python or configuring it visually. If you haven't mapped out your full backtest workflow yet, get that sequence locked down before you tune commission parameters, since the order in which costs get applied changes your results.
Testing Commission Sensitivity Against Live Fills
The only way to know whether your commission model is realistic is to run the same strategy twice: once with zero costs, once with your full cost stack applied. The difference between the two runs is your cost drag, and it should be reported as its own metric, not buried inside a single net Sharpe ratio.
A solid A/B protocol looks like this:
- Run the baseline with all costs set to zero and record gross returns, Sharpe, and max drawdown.
- Run the identical strategy with your full cost stack (commission plus spread plus slippage plus exchange fees) and record the same three metrics.
- Compute cost drag as the percentage difference between gross and net returns, and track how that percentage changes across trade size buckets.
- Report the distribution of cost per trade, not just the average, since a handful of small positions hitting fee minimums can skew your mean cost figure badly.
- Track turnover versus cost to see whether your strategy's edge survives at realistic trading frequency.
For high-frequency or scalping strategies, even a small per-share rate or a $1 minimum can erase the edge entirely, which is why sensitivity testing across trade size specifically matters more than testing at a single fixed size.
Source your commission and spread inputs from primary broker fee schedules and Rule 606 execution quality reports rather than third-party "cheapest broker" roundups, which routinely miss FX markups and per-order minimums. Academic analysis of the shift to commission-free trading found that eliminating headline commissions reduced total retail transaction costs on average, but effective spreads barely moved. That's a reminder that a "$0 commission" broker isn't a $0-cost broker.
Pro Tip: When you validate, reconcile a sample of your backtest's transaction timestamps against actual live fills and compute the realized spread at the entry timestamp. A mismatch usually points to timestamp misalignment or routing differences rather than a broken commission model.
This is exactly the kind of reproducible sensitivity test Trade-4 was built to run: same-day re-entry analytics and tick-accurate historical data down to one second let you isolate cost drag from strategy logic instead of guessing at both simultaneously.
What Traders Consistently Get Wrong About Commission Modeling
Most quants treat commission modeling as an afterthought, something you bolt onto a backtest once the strategy logic already looks profitable. That's backwards. Measure your real costs before you optimize anything else, because a strategy that only works at zero cost isn't a strategy, it's a rounding error waiting to happen.
The traders who get this right don't build the most sophisticated cost model. They build the most accurate simple one, test its sensitivity across position sizes, and validate it against real fills. Complexity for its own sake, modeling exotic rebate structures your broker doesn't even offer, wastes time better spent checking whether your spread assumption matches what actually shows up on your fill confirmations.
Broker pricing and liquidity profiles change. Revisit your commission assumptions whenever your broker updates its fee schedule or your strategy migrates to a different liquidity tier, and document every assumption so the next version of your backtest isn't guessing at what the last one meant.
— Romans
Run Your Own Cost-Sensitivity Test on Trade-4
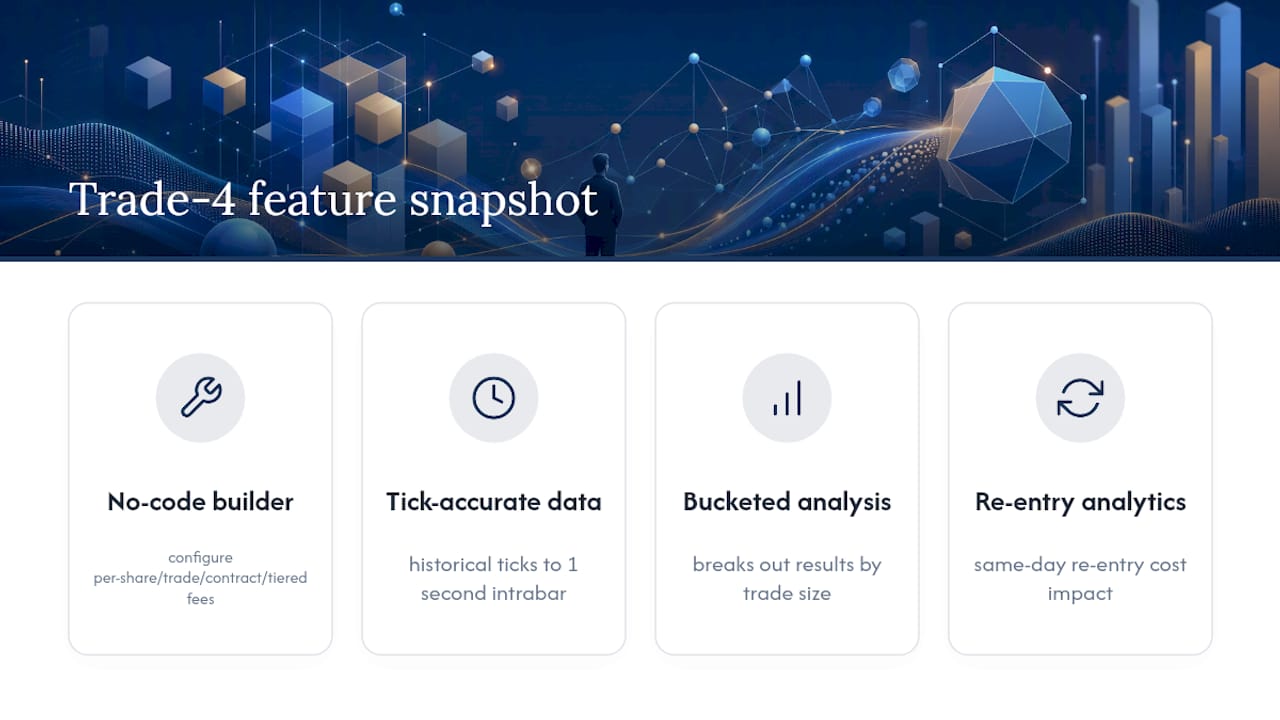
Trade-4 gives you a faster path to the exact commission modeling backtest this article just walked through, without writing a single line of YAML or Python. Its no-code visual builder lets you configure per-share, per-trade, per-contract, and tiered commission structures directly in your strategy setup, then run the same test with and without costs to see your real cost drag in minutes instead of hours.

Because Trade-4 runs on tick-accurate historical data down to one second, your cost-sensitivity tests reflect real intrabar execution instead of bar-close approximations that hide slippage. Bucketed performance analysis breaks out results by trade size automatically, so you can spot exactly where fixed minimums start distorting your cost per share, the same distortion this guide showed at 100 shares versus 1,000. Same-day re-entry analytics let you see whether commission costs are quietly punishing your re-entry logic specifically.
If you're still refining your entry criteria, pair this with a look at how fee assumptions affect small-cap backtest reliability, where minimums do the most damage.
Start with the getting-started guide to configure your first cost stack, or head straight to the Trade-4 backtester to run a zero-cost and full-cost comparison on your own strategy today.
Key Docs and Studies to Consult
- Slippage modeling implementation guide
- Tick data backtesting workflows
- Walk-forward validation guide
- Broker fee schedules and Rule 606 execution reports