
For algorithmic traders who need auditable, latency-aware results, tick data backtesting requires three non-negotiable components: deterministic replay, a validated tick feed with documented provenance, and a fill/latency model that accounts for queue position. The fastest path to a trustworthy first result is a single-symbol, single-month experiment using Parquet shards and an immutable run manifest.
Start with this minimal reproducible experiment:
- Symbol and window: one liquid US equity or futures contract, one calendar month of data
- Data format: Parquet shards, one file per day, with exchange time and receive time columns preserved
- Config snapshot: a YAML file pinned to a git hash before the run starts
- Required artefacts to produce:
manifest.json(git hash + dependency versions),config.yaml(frozen),replay.log,trades.parquet, and a summary report
Pro Tip: Before running any strategy logic, replay the raw feed with no signals and verify that aggregated VWAP and trade counts match the source vendor's published statistics for that period. This single check catches the majority of ingestion bugs.
Key Takeaways
Tick data backtesting produces trustworthy results only when deterministic replay, validated data provenance, and a realistic fill model are all present from the start.
| Point | Details |
|---|---|
| Deterministic replay is non-negotiable | Pin a git hash and config snapshot before every run; two identical manifests must produce identical output. |
| Validate the feed before strategy logic | Check monotonic timestamps, finite spreads, and sequence ID continuity on every Parquet shard. |
| Fill models require queue position | Model limit-order fills as a function of visible volume and time-in-queue, not as deterministic best-price fills. |
| Incremental validation saves time | Test trades-only replay first, then add quotes, then L2 reconstruction, then fills. |
| Trade-4 for small-cap tick testing | Trade-4 delivers 1-second granularity and reproducible reports for small-cap US equities without local infrastructure. |
Table of Contents
- What tick data backtesting is and when you need it
- Why tick resolution produces more accurate backtest results
- Tick data types and the file formats you will encounter
- Where to source US tick data by asset class
- Replay engines, tooling patterns, and integration models
- Deterministic methodology and validation checklist for reproducible tick backtests
- How to set up a minimal reproducible tick pipeline
- Throughput, sharding, and infrastructure trade-offs
- Common mistakes that invalidate tick backtests
- When to invest in tick backtesting and what success looks like
- The part most quants skip: incremental validation
- Trade-4 gives small-cap traders a no-code path to tick-accurate results
- Sources
What tick data backtesting is and when you need it
Tick data backtesting means replaying every trade, quote, or order-book event in its original sequence to test strategy logic, fill behavior, slippage, and timing at the resolution the market actually produces. Unlike bar-level tests, which compress activity into fixed intervals (1-minute, 5-minute, daily), tick-level replay preserves the exact ordering of events within a bar, which is where most execution-sensitive strategies live or die.
You need tick-level fidelity when:
- Your strategy enters or exits within a single bar (scalping, intraday momentum)
- You are modeling limit-order fills and need queue-position estimates
- You are running latency-sensitive arbitrage where milliseconds determine whether a fill occurs
- You are doing market-making or HFT research that depends on bid/ask spread dynamics
- You need to validate execution costs against a realistic spread and market-impact model
- Academic research shows tick-sequence analysis better captures the timing and duration of price shocks than fixed-interval sampling, reducing misclassification of flash events
Bar-level backtests remain sufficient when:
- Your holding period spans multiple bars and fills are not timing-sensitive
- You are testing a daily mean-reversion signal on liquid large-caps
- Your strategy uses market orders on highly liquid instruments where slippage is predictable and small
- You are doing a first-pass feasibility screen before committing to tick-level infrastructure
The practical rule: if your strategy's profitability depends on where within a bar a fill occurs, bar-level testing will produce misleading results. Tick replay is the correct tool.
Why tick resolution produces more accurate backtest results
The core benefit is the elimination of within-bar ambiguity. A 1-minute bar tells you the open, high, low, and close, but not the sequence. A strategy that buys on a breakout above the high and then stops out on the low of the same bar looks profitable on bar data and catastrophic on tick data. That gap between the two results is not a modeling artifact; it is the actual cost of imprecise execution assumptions.
Specific advantages tick-level replay delivers:
- Slippage realism: spread capture at the actual bid/ask at the moment of signal, not a synthetic mid-price
- Partial fill modeling: large orders that consume multiple price levels are split correctly across queue depth
- Timing bias removal: no lookahead from bar-close prices being used as entry prices
- Market-impact visibility: repeated fills in the same direction show cumulative price pressure
Data-driven HFT measures trained on transaction-level data outperform simple proxies and respond to infrastructure changes, confirming that tick-sequence fidelity affects empirical conclusions about market microstructure, not just execution simulation.
Statistic callout: Tick-sequence-based analysis has been shown to prevent mischaracterization of flash events that fixed-interval sampling routinely mislabels, a finding with direct implications for any strategy that trades around volatility spikes or news catalysts.
Tick data types and the file formats you will encounter
Understanding what you are ingesting before you build a parser saves significant debugging time.
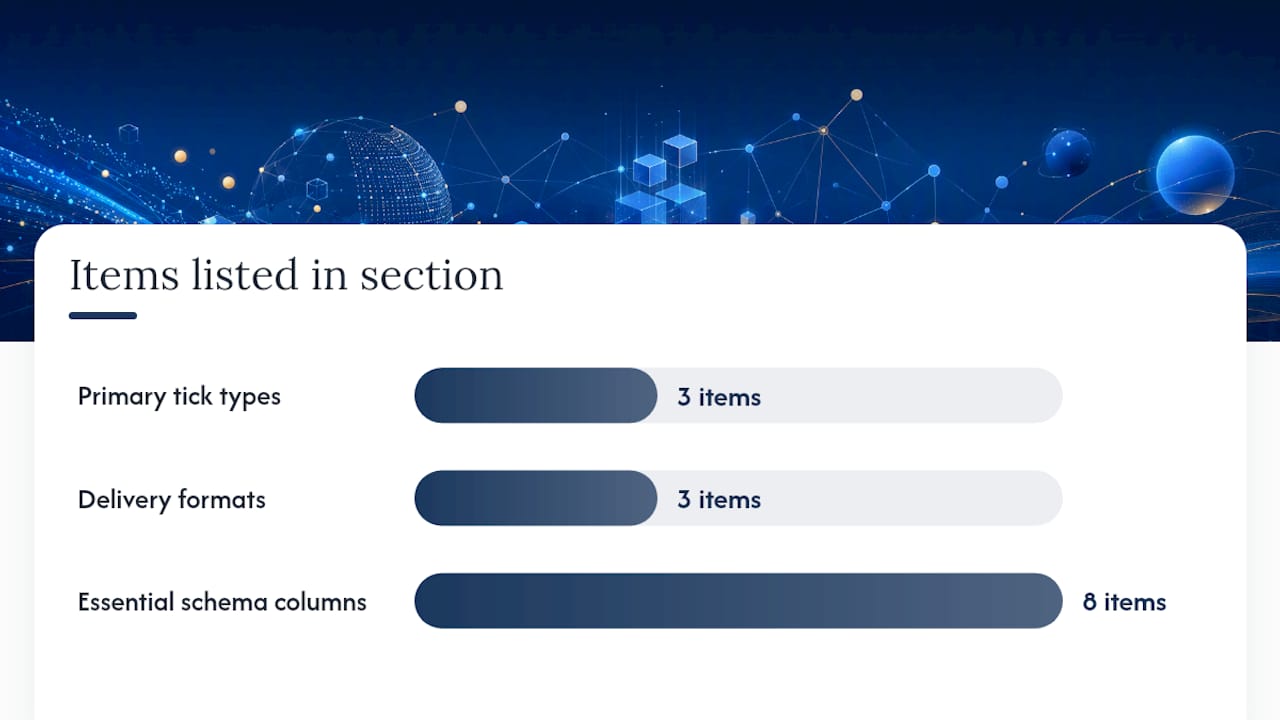
The three primary tick types:
- Trade ticks: a single executed transaction with price, size, exchange timestamp, and a sequence ID or matching ID
- Quote ticks (BBO): best bid/offer snapshots or updates, including bid price, bid size, ask price, ask size, and timestamp
- Order-book deltas (L2/L3): incremental updates to the full order book, requiring reconstruction to produce a market-by-price (MBP) or market-by-order (MBO) snapshot
Common delivery formats:
- Raw ITCH: binary, exchange-native, requires a dedicated parser; used by NASDAQ and several other venues
- Normalized CSV: human-readable, large file sizes, slower to ingest at scale
- Parquet shards: columnar, compressed, fast to read with pandas or PyArrow; the recommended format for large-scale reproducible runs
Essential schema columns for any tick dataset:
| Column | Description |
|---|---|
exchange_ts | Timestamp assigned by the exchange matching engine |
receive_ts | Timestamp when your feed handler received the message |
normalized_ts | Cleaned, monotonic timestamp used for replay ordering |
price | Trade or quote price in native currency |
size | Quantity in shares or contracts |
side | Buy/sell or bid/ask indicator |
sequence_id | Exchange-assigned sequence number for ordering |
tick_type | Trade, quote, book delta, or auction |
Vendors that expose timing provenance across all three timestamp fields and provide manifest-level confidence states simplify deterministic replay and troubleshooting considerably.
Pro Tip: Always preserve both exchange_ts and receive_ts in your Parquet schema. Replay should order by exchange_ts for strategy logic, but receive_ts is essential for latency modeling and for diagnosing feed gaps.
Where to source US tick data by asset class
The right source depends on your asset class, the tick types you need, and whether you require redistribution rights.
Major US-relevant sources:
- TAQ (Trade and Quote): NYSE's consolidated Trade and Quote dataset covers US equities across all exchanges; provides trades and NBBO quotes; available via WRDS for academic users and directly for commercial subscribers
- CME DataMine: CME Group's historical data service for futures and options; provides MBO (market-by-order) and MBP (market-by-price) data in binary format; the authoritative source for E-mini S&P 500, crude oil, and other CME products
- Polygon.io: REST and WebSocket API for US equities, options, and crypto; provides trades, quotes, and aggregates; well-suited for programmatic ingestion and Parquet export workflows
- QuantQuote: US equities tick history with survivorship-bias-free symbol coverage; delivers normalized CSV and supports historical depth going back to the early 2000s for many symbols
- Dukascopy: widely used for FX tick data; provides free historical tick downloads in CSV format; commonly used in FX strategy research and Parquet conversion workflows
- LOBSTER: reconstructs full NASDAQ order-book depth from ITCH feed data; provides L2 snapshots and message-level data; the standard academic source for NASDAQ limit-order book research
- Tick Data Suite: a commercial toolkit that integrates with MetaTrader and provides tick-accurate historical data with configurable spread and slippage models; popular for FX and CFD strategy testing
Selection checklist:
- Confirm asset coverage matches your instrument universe (equities, futures, FX, crypto)
- Verify tick types available: trades only, trades + quotes, or full L2/L3 order book
- Check historical depth: how many years back does the data go?
- Confirm delivery format: API, bulk CSV, Parquet shards, or raw ITCH
- Review licensing: redistribution rights matter if you share results or publish research
- Request a sample for your target symbol and date range before committing
When you need L2/L3 versus trades+quotes only: if your strategy models queue position, partial fills, or market-making spreads, you need L2 or L3 data. For most directional intraday strategies, trades + BBO quotes are sufficient and substantially cheaper to store and process.
Replay engines, tooling patterns, and integration models
Four architectural patterns cover most production tick-backtest setups.
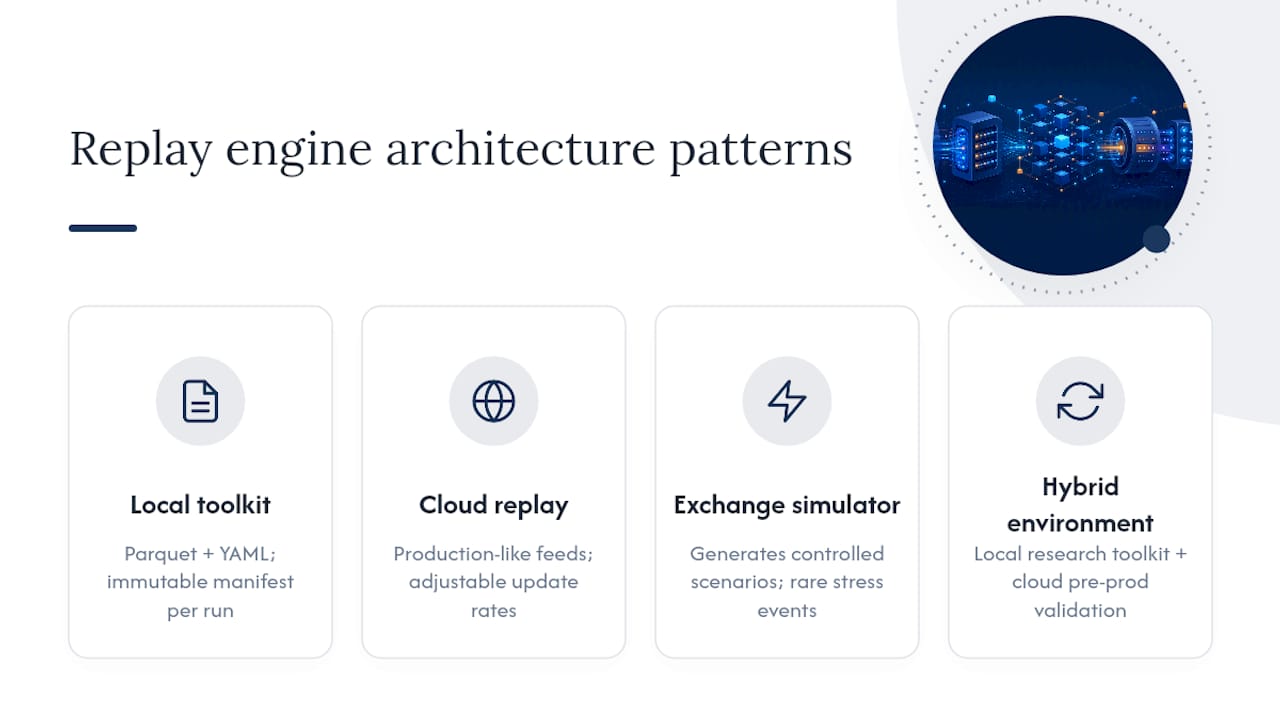
Local deterministic toolkit (Parquet + YAML config): the most reproducible pattern. You store Parquet shards locally or on a network file system, define strategy parameters in a YAML config, and run a replay engine that writes an immutable manifest on each run. The tick-backtest toolkit documents exactly this workflow, producing manifest.json, trades.parquet, and performance reports from a config-first, deterministic run. This pattern is ideal for research and strategy development where auditability matters.
Cloud-based replay-as-a-service: cloud-based market-data testing solutions can be provisioned on short-term contracts and replay configurable, production-like feeds at adjustable updates-per-second rates. This pattern suits regulatory testing (including DORA compliance) and resilience validation without requiring local infrastructure.
Exchange simulator / digital twin: simulators generate controlled market scenarios, including rare stress events that historical feeds may not contain. Exactpro recommends combining exchange simulators with dedicated test environments in a hybrid approach: simulators are most valuable early in development and for non-functional testing; dedicated replay environments handle integration and user-acceptance testing.
Hybrid environments: combining a local deterministic toolkit for strategy research with a cloud replay layer for pre-production validation gives you the best of both patterns.
Pro Tip: Prefer CLI + API parity in your tooling: every run that can be triggered via API should also be reproducible from a single CLI command with the same config file. This makes debugging and peer review substantially faster.
Deterministic methodology and validation checklist for reproducible tick backtests
A reproducible tick backtest is not just a matter of saving your code. It requires a structured checklist executed in a fixed order.
- Validate your config schema before any data is loaded. Reject runs with missing required fields, invalid parameter ranges, or unresolved symbol mappings.
- Pin your manifest at run start: record the git hash of your strategy code, the exact versions of all dependencies, the data source identifier, and the shard file checksums.
- Check timestamp monotonicity across every shard: non-monotonic timestamps are the single most common cause of lookahead bias in tick replays.
- Verify finite spreads in quote data: zero spreads and infinite spreads both indicate feed corruption and must be filtered or flagged before replay.
- Confirm sequence ID continuity where the exchange provides it: gaps in sequence IDs indicate dropped messages and require gap-fill or explicit handling.
- Set a warmup period (
warmup_seconds) sufficient for all indicators and order-book state to initialize before the strategy begins generating signals. - Run a no-signal validation pass: replay the feed with all strategy logic disabled and compare aggregated VWAP, trade counts, and spread distributions against the vendor's published statistics.
- Apply your fill model: queue-position modeling, latency distribution sampling, and order-book reconstruction are the standard components for realistic limit-order fill simulation. Model fill probability as a function of visible volume, time-in-queue, and empirical cancel rates rather than assuming deterministic fills at best price.
- Run unit tests for each data adapter using a structured test matrix (subscribe historical quotes, trades, book snapshot requests) before running large-scale backtests. CFTC research on transaction-level data confirms that millisecond timestamps, unique matching IDs, and preprocessing steps for canceled or irregular transactions are essential for accurate trade-by-trade reconstruction.
- Write the output manifest last: after the run completes, append the output file checksums (
trades.parquet,report.json) to the manifest so the full run is auditable end-to-end.
Pro Tip: Use a fixed random seed for any stochastic component (latency sampling, partial fill simulation) and record it in the manifest. Two runs with identical seeds and identical data must produce byte-identical trades.parquet output. If they do not, you have a non-determinism bug.
How to set up a minimal reproducible tick pipeline
This sequence covers the concrete steps from raw data to auditable output.
- Prepare Parquet shards: convert raw CSV or ITCH data to Parquet, one file per symbol-month. Validate that each shard contains
exchange_ts,receive_ts,price,size,side, andsequence_idcolumns. - Run the validator: check monotonic timestamps, finite spreads, sequence ID gaps, and schema completeness. Log all anomalies to
validation.log. - Produce the manifest and config snapshot: freeze
config.yamlwith the git hash, shard checksums, and dependency versions. Writemanifest.jsonbefore any strategy logic runs. - Run deterministic replay: execute the replay engine with
warmup_secondsset, the frozen config, and the validated shards as input. - Generate output artefacts: the run produces
trades.parquet,equity_curve.parquet,report.json, and an updatedmanifest.jsonwith output checksums.
Recommended folder layout:
| Path | Contents |
|---|---|
data/raw/{symbol}/{YYYY-MM}.parquet | Validated input shards, one per symbol-month |
runs/{run_id}/config.yaml | Frozen strategy config for this run |
runs/{run_id}/manifest.json | Git hash, shard checksums, dependency versions |
runs/{run_id}/trades.parquet | All simulated fills with timestamps and prices |
runs/{run_id}/report.json | Summary metrics: PnL, drawdown, Sharpe, fill rate |
logs/{run_id}/replay.log | Event-level replay log for debugging |
Key configuration notes:
- Set
warmup_secondsto at least the longest lookback window your indicators use, plus a buffer for order-book state initialization - Shard boundaries must align with calendar days or months; never split a shard mid-session, as this creates artificial gaps at boundaries
- Strategy configs should reference data paths by relative path, not absolute, so runs are portable across machines
For a step-by-step walkthrough of how to apply this pipeline to a small-cap strategy, the Trade-4 backtesting guide covers the ingest-to-report sequence in detail.
Throughput, sharding, and infrastructure trade-offs
Performance at scale is primarily an I/O problem, not a compute problem. Most tick replay engines are CPU-bound only when fill models involve complex order-book reconstruction; otherwise, the bottleneck is reading data from disk or object storage.
Practical throughput considerations:
- Parquet columnar reads with PyArrow or Rust-based readers typically process tens of millions of ticks per second per core for simple replay logic; order-book reconstruction with L2 deltas reduces this by an order of magnitude
- JIT-compiled implementations (Numba, Rust) reach higher tick-per-second rates for market-making backtests with full order-book state, as demonstrated by open-source HFT backtest projects
- Sharding by symbol-month enables embarrassingly parallel runs: each shard is independent and can be processed on a separate core or worker
Sharding strategy:
- Shard by symbol-month for equities; by contract-month for futures
- Keep shard files under 500 MB for efficient memory-mapped reads
- Store shards on local NVMe for maximum throughput; use cloud object storage (S3, GCS) for archival and distributed runs where network bandwidth is not the bottleneck
Infrastructure patterns:
- Single-machine local NVMe: best for development and small symbol universes (under 50 symbols)
- Distributed workers reading from object storage: scales to full market replays but requires careful manifest coordination to maintain determinism across workers
- Columnar compression (Snappy or Zstd for Parquet) reduces storage cost by 60–80% versus uncompressed CSV with minimal read-time overhead
Statistic callout: Open-source HFT backtest projects using JIT compilation demonstrate that full order-book reconstruction with queue-aware fill simulation is computationally feasible for research-scale datasets, though throughput drops significantly relative to trade-only replay.
Common mistakes that invalidate tick backtests
Most tick backtest failures fall into three categories: bad data, bad configuration, and bad fill assumptions.
Data quality red flags to check before any run:
- Non-monotonic timestamps within a shard (sort and count inversions)
- Duplicate ticks with identical sequence IDs and timestamps
- Zero or negative spreads in quote data
- Missing sequence IDs indicating dropped messages
- Timezone mismatches between exchange time and receive time fields
Behavioral mistakes:
- Setting
warmup_secondstoo short, so indicators are uninitialized when the strategy starts generating signals - Misaligned shard boundaries that place the last tick of one session in the next session's shard, creating a one-tick lookahead
- Assuming deterministic fills at best price without modeling queue position; ignoring queue depth can substantially mis-estimate fill rates for limit orders
- Using survivorship-bias-affected symbol lists: always use a point-in-time universe that includes delisted symbols
Debugging checklist:
- Run
assert df['exchange_ts'].is_monotonic_increasingon every shard before replay - Check
df.duplicated(subset=['exchange_ts','sequence_id']).sum()and log any non-zero result - Verify
(df['ask_price'] - df['bid_price']).min() > 0for all quote shards - Compare your replay's total trade count and VWAP for the period against the vendor's published figures
- Run two identical replays with the same seed and diff the output
trades.parquetfiles; any difference indicates a non-determinism bug
Pro Tip: Automate adapter validation with a structured test matrix covering instrument subscription, historical quote requests, book delta handling, and trade subscription before running any large-scale backtest. Silent protocol mismatches between your adapter and the data vendor are far more common than most teams expect.
When to invest in tick backtesting and what success looks like
Tick-level replay is the right investment when your strategy's edge depends on execution timing, spread capture, or limit-order fill rates.
A one-week experiment plan:
- Pick one symbol you trade actively, one month of recent data
- Source trades + BBO quotes in Parquet format from Polygon.io or QuantQuote
- Run the validator, produce the manifest, and execute a no-signal replay to confirm data integrity
- Add your strategy logic and run with a queue-position fill model
- Compare simulated slippage and fill rate against your actual execution records for the same period
Success metrics:
- Reproducibility: two runs with identical manifests produce byte-identical
trades.parquetoutput - Statistical plausibility: your replay's VWAP and trade count match the vendor's published figures within 0.1%
- Execution realism: simulated slippage is within a reasonable range of your realized slippage from live trading
- Fill rate accuracy: your limit-order fill rate in simulation matches historical fill rates for comparable order sizes
If all three hold, your tick backtest infrastructure is trustworthy. If simulated slippage consistently understates realized slippage, refine your queue-position model before drawing strategy conclusions.
The part most quants skip: incremental validation
The most common failure mode in tick backtest infrastructure is not a bug in the strategy logic. It is a silent data problem that was never caught because the pipeline was never validated incrementally.
The correct sequence is to test by increasing complexity: validate trades-only replay first, then add quote data and verify spread statistics, then add L2 order-book reconstruction and check depth distributions, and only then introduce fill modeling. Each layer has its own failure modes. Collapsing all four into a single run and debugging the combined output is the slowest possible path to a working system.
There is also a subtler point about fill models: most practitioners underestimate how much queue position matters for limit orders in US equities. Getting this wrong does not just affect PnL estimates; it changes which strategies appear viable in the first place.
Trade-4 gives small-cap traders a no-code path to tick-accurate results
Running the methodology described in this article typically requires local database management, custom Parquet pipelines, and bespoke config tooling. Trade-4 removes that infrastructure burden entirely. The platform delivers tick-accurate historical data at 1-second granularity for small-cap US equities, with visual pattern and strategy builders that replace YAML config files, and reproducible run reports that replace manual manifest management.

Three concrete use cases where Trade-4 fits the methodology directly:
- Gap and runner strategy validation: use Trade-4's gap % and volume threshold filters to test intraday small-cap setups with the same entry/exit precision that tick-level replay provides, without writing a single line of code
- Re-entry analytics: Trade-4's same-day re-entry feature maps directly to the fill-rate and timing analysis this article recommends, letting you measure how often a second entry after a stop-out is statistically justified
- News-tagged performance bucketing: tag runs by news catalyst and compare slippage and fill rates across catalyst types, a workflow that mirrors the market-impact visibility benefits of tick-level testing
Start your first reproducible experiment on Trade-4 today. The getting-started guide walks you through your first backtest in minutes, and pricing plans scale from a free trial to full historical depth.
Sources
- Market data testing (LSEG)
- Tick-sequence analysis prevents mischaracterizing flash events (Springer, 2025)
- tick-backtest (PyPI) / documentation
- Market data systems testing | Exactpro
- Marketdata
Where to run this on Trade4
Run tick-accurate small-cap experiments without managing Parquet pipelines yourself:
- Follow the getting started guide
- Configure gap and volume filters in the Strategy Builder
- Check pricing for 1-minute through 1-second bars
- Continue with gap short backtesting and the step-by-step backtest guide