
A trade chart review is a structured, post-trade audit of tick-accurate price charts and execution data used to check whether you followed your own rules and whether your backtest assumptions held up in reality. Done right, it turns fuzzy memories and isolated screenshots into repeatable evidence you can use to fix your backtest, your execution model, or both. This guide gives you the checklist, the workflow, and the tooling habits to make that happen.
TL;DR:
- Small-cap traders should prioritize explicit cost and liquidity modeling, as backtest assumptions often fail in real trading conditions with spreads and delistings.
- Conduct weekly trade reviews on a random, representative sample with normalized data to identify systematic execution issues and bias patterns across setups.
- Check for common biases like look-ahead, survivorship, overfitting, and unrealistic cost modeling, as these can produce overoptimistic backtest results that degrade with real fills.
- Require at least 100 trades before trusting pattern analysis or error category significance, and treat shorter streaks as signals for review rather than rule changes.
- Use structured, exportable data with standardized fields for consistent, repeatable reviews that feed back into refining backtest assumptions and strategy execution.
Table of Contents
- What Trade Chart Review Is (and Why It's Not Backtesting)
- Trade Anatomy: The Fields Every Reviewed Trade Needs
- How Do You Run a Weekly Trade Chart Review?
- What Data Biases Should You Check During Review?
- How Many Trades Do You Need Before Changing Your Playbook?
- Templates, Exports, and Tooling for Repeatable Reviews
- From Screenshots to Structured Evidence: What Actually Changes
- Turn Chart Review Into a Repeatable Backtest Advantage
What Trade Chart Review Is (and Why It's Not Backtesting)
A backtest tests a hypothesis. It asks: "If I had followed this exact rule set on historical data, would it have worked?" Trade chart review asks a different question entirely: "Did I actually follow the rule set, and did the market behave the way my backtest assumed it would?"
That distinction matters most in small-cap trading, where liquidity dries up fast, spreads widen without warning, and delistings can quietly distort your historical data. A backtest built on data excluding delisted stocks can look good but still fail in real trading. Small-cap strategies need explicit cost and liquidity modeling because implementation friction such as thin depth, wide spreads, and limited capacity, is more severe than in large-cap stocks.
Chart review won't hand you guaranteed alpha. What it will do is expose operational leaks: late entries, oversized positions, exits that ignored your stop, or a backtest that never accounted for a stock getting halted. Those are fixable. Once you know where the leak is, you either patch your execution habits or feed the correction back into your backtest assumptions.
Trade Anatomy: The Fields Every Reviewed Trade Needs
A trade review is only as useful as the data behind it. Reviewing screenshots one at a time invites the same bias you're trying to eliminate: your memory fills in gaps your chart doesn't show. Structured fields fix that, because they force you to record the same data points every single time, whether the trade won or lost.
Build your template around five stages:
- Pre-trade: setup name, gap %, float, volume relative to average, catalyst or news tag
- Execution: order type, intended entry price, actual fill price, time to fill
- In-trade: maximum adverse excursion (MAE), maximum favorable excursion (MFE), time in trade, any rule violations
- Exit: exit reason (stop, target, discretionary), exit price, slippage versus plan
- Post-trade: R-multiple, capture rate (how much of the available move you actually captured), error category
MAE tells you how much heat a trade took before it worked out, which is critical for sizing stops correctly. MFE shows how much profit was on the table before you exited, and capture rate compares what you took versus what was available. Error categories (late entry, early exit, size violation, no violation) let you run pivot tables later and see which mistake is actually costing you money.
Pro Tip: Keep a "clean chart" version with no annotations for objective review, and a separate "marked chart" with your entries and exits labeled for execution review. Mixing the two invites you to rationalize decisions after the fact instead of grading them honestly.
Export everything as JSON or CSV rather than relying on screenshots. A folder of PNGs cannot be aggregated, filtered, or run through a pivot table. A structured export can, and that's the difference between a review process and a scrapbook.
How Do You Run a Weekly Trade Chart Review?
Set a fixed cadence. Reviewing sporadically means you catch problems only when they're big enough to notice, which is too late for a small-cap strategy running tight risk parameters.
- Select your sample. Pull a random subset of the week's trades, then add every trade that hit an edge case: your largest winner, largest loser, and any trade where you overrode a rule.
- Normalize the data. Adjust for stock splits, dividends, and timezone mismatches between your data feed and your execution timestamps. A one-minute timezone error can make a legitimate fill look like slippage.
- Wait before you look. A short delay between trade close and review, roughly ten to twenty minutes at minimum, cuts down on the urge to rationalize a bad decision while it's still emotionally fresh.
- Annotate and compute. Fill in MAE, MFE, capture rate, and error category for each trade in your sample. Tag each one against your setup taxonomy so you can group results later.
- Run cohort analysis. Group trades by setup, by float range, by time of day, and by error category. Look for clusters, not one-off anomalies.
- Apply decision gates. If a bias shows up across the cohort (say, entries consistently filling worse than your backtest assumed), that's a signal to adjust your slippage model. If it's a single trade, log it and move on.
Two categories of follow-through matter here:
- Update backtest assumptions when the cohort data shows a systematic gap between planned and actual fills.
- A/B test a live rule change only after the backtest has been corrected and re-validated, never before.
Skipping the wait step or reviewing only your winners are the two fastest ways to turn a review process into a confidence-building exercise instead of a diagnostic one.
What Data Biases Should You Check During Review?
Every backtest carries hidden assumptions, and chart review is where you catch them before they cost you money live. Four biases show up most often in small-cap systems.
- Look-ahead bias: your signal logic accidentally uses information that wasn't available at the time of the bar. Fix it by confirming signals only trigger on closed bars and execute on the next bar's open, never the current one.
- Survivorship bias: your historical universe only includes stocks that still exist today, quietly excluding the ones that got delisted or went to zero. Fix it with point-in-time constituent data that includes delisted names.
- Overfitting and multiple testing: you tuned parameters until the backtest looked great, which usually means it was memorizing noise. Reserve 30 to 50% of your data for out-of-sample testing and run a proper walk-forward validation before trusting the result.
- Unrealistic cost modeling: your backtest assumes fills at the mid-price with no slippage. Fix it by charging a conservative, modeled slippage and commission on every simulated trade, not just the ones that look marginal.
Each of these produces the same symptom: a backtest that looks strong in isolation and degrades once real fills enter the picture. Chart review is where that gap gets caught early, while it's still cheap to fix.
How Many Trades Do You Need Before Changing Your Playbook?
Sample size discipline keeps you from rewriting your rules based on noise. Treat these as rough thresholds, not hard laws.
- Around 30 trades: enough for a diagnostic look. Useful for spotting an obvious execution error, not for concluding a setup is broken.
- Around 100 trades: enough to start trusting a pattern in error categories or capture rate across a single setup.
- 300 or more trades: the level where a statistical claim about win rate or expectancy starts to carry real weight.
A short losing streak, three to five trades, almost never justifies rewriting a rule. It usually calls for a review, not a rewrite. Before implementing any playbook change, run a quick Monte Carlo or binomial check against your historical trade distribution to see whether the losing streak falls inside normal variance or actually signals a broken edge.
Templates, Exports, and Tooling for Repeatable Reviews
Consistency depends on the schema, not the willpower to fill out a spreadsheet every day. Your export should carry, at minimum: trade ID, setup tag, entry and exit timestamps, planned versus actual fill price, MAE, MFE, R-multiple, capture rate, error category, and any news catalyst tag.
- Standardize field names across every export so you can merge weeks or months of reviews without manual cleanup.
- Keep news tags as a separate field rather than free text. A binary or categorical tag ("earnings", "dilution", "no catalyst") is searchable; a paragraph of notes is not.
- Store same-day re-entry attempts as linked records rather than standalone trades, since grouping them reveals whether re-entries are adding edge or just adding risk.
Tick-accurate charts down to the one-second level matter more in small caps than anywhere else, because a five-minute bar can hide the exact moment a spread blew out or a halt triggered. News tagging tied to that same timeline lets you separate catalyst-driven volatility from pure noise. A review software approach built around forensic performance analysis reinforces the same principle: structured, exportable data beats a folder of annotated screenshots every time. Once your review is exported cleanly, feed the findings straight back into your backtest pipeline so the next test run reflects what actually happened, not what you assumed would happen.
From Screenshots to Structured Evidence: What Actually Changes
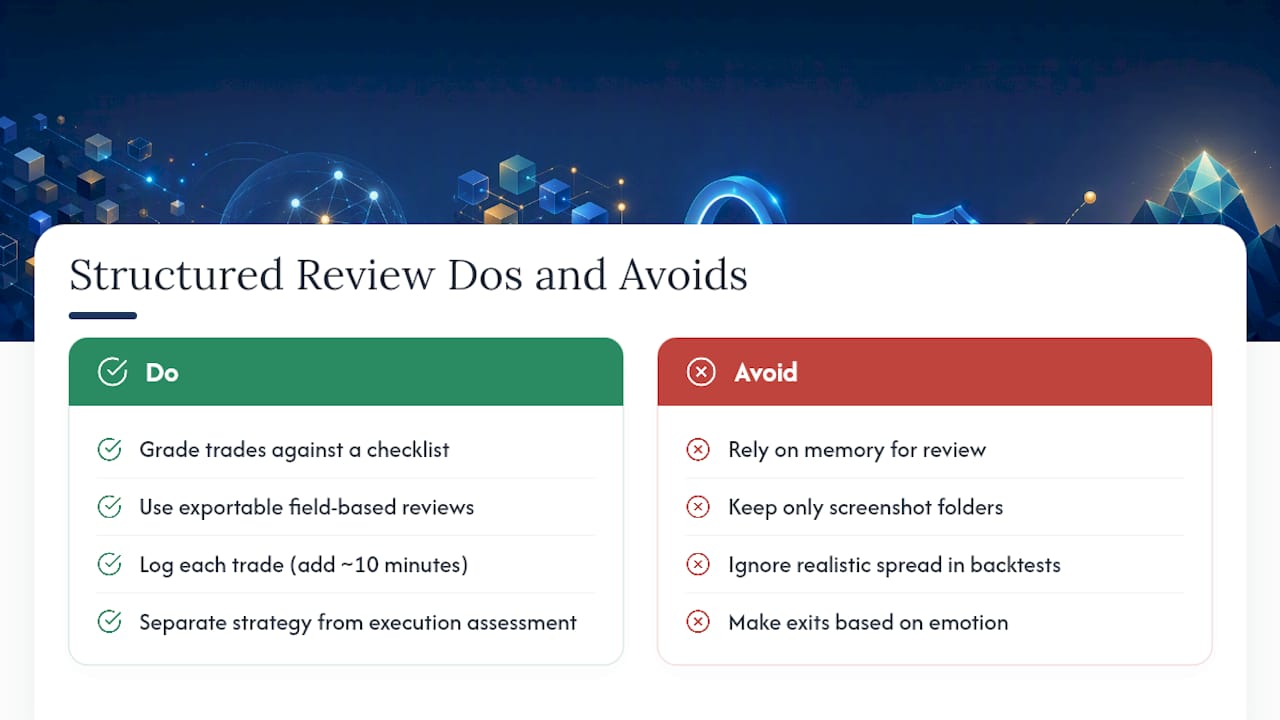
The traders who benefit most from structured review aren't the ones with the fanciest setups. They're the ones willing to grade themselves against a checklist instead of a memory. Moving from folders of chart screenshots to exportable, field-based reviews tends to surface the same handful of issues: entries that fill worse than modeled, exits driven by emotion rather than the plan, and backtests that never priced in a realistic spread.
None of this replaces sound strategy design. It just removes the guesswork about whether your strategy is failing or your execution is. That distinction is worth the extra ten minutes a trade takes to log properly.
— Romans
Turn Chart Review Into a Repeatable Backtest Advantage
Most chart review breaks down at the export stage. You catch a pattern in your notes, but there's no clean way to feed it back into your backtest without rebuilding the whole simulation by hand. Certain no-code visual pattern builders let you encode what you found in review as a rule, then re-run it against tick-accurate historical data down to the one-second level.

News tagging can flag which trades were catalyst-driven before you even start your cohort analysis, and re-entry analytics can show whether your re-entries are adding real edge or just adding risk. Trial results tend to show up fast: sharper slippage estimates within the first few backtest runs, and error categories that finally match what your charts are telling you. Start a run on the Trade4 backtester and see what your last month of trades actually looked like under a structured review.