
Parameter sensitivity backtesting shows you whether your strategy's edge comes from a real market pattern or from a lucky combination of numbers. Run it right after optimization, before you touch walk-forward testing or live capital. If performance stays strong across a wide, flat band of parameter values, you have something durable. If profit collapses the moment you nudge a setting by a few percent, you've built a curve-fit that will fail in real trading.
TL;DR:
- Parameter sensitivity analysis should be performed immediately after optimization to identify if strategy performance is robust or overfitted to specific settings.
- Testing methods like grid sweeps, Monte Carlo sampling, or hyperparameter optimization reveal different interaction effects and scaling efficiencies suitable for various research stages.
- Heatmaps and interaction plots help visualize parameter dependencies, with diagonal bands indicating genuine interactions that require joint tuning.
- Stability scores, variance, and bootstrap confidence intervals quantify how sensitive a strategy is to parameter changes and help avoid overfitting signals.
- Running out-of-sample, regime-based validation is essential to confirm the strategy's robustness before live deployment, and Trade-4 offers tools for streamlined sensitivity testing without coding.
Table of Contents
- What Parameter Sensitivity Analysis Is and When to Run It
- Practical Methods: OAT, Grid Sweeps, Monte Carlo, and HPO
- Interaction Analysis: Reading Heatmaps and Interaction Plots
- Statistical Measures: Stability Scores, Gradients, and Bootstrap Confidence Intervals
- Best Practices and the Red Flags That Signal Overfitting
- The Workflow: Optimize, Test Sensitivity, Check Interactions, Validate Out-of-Sample
- Tools and Reproducible Implementations
- How Trade4 Puts Sensitivity Testing Into Practice
- What Small-Cap Sensitivity Testing Actually Teaches You
- Run Your Sensitivity Tests Without Writing a Single Line of Code
- Further Reading
What Parameter Sensitivity Analysis Is and When to Run It
Parameter sensitivity analysis measures how much your strategy's performance changes when you shift individual inputs, like a moving average length, a gap percentage threshold, or a volume filter, away from their optimized values. The goal is to detect fragility before it costs you money. A strategy tuned to one exact combination of numbers usually reflects overfitting rather than a genuine edge.
You run this analysis at one specific point in your research cycle: right after optimization finds your best parameter set, and before you commit to walk-forward validation or live deployment. Skipping it means you're taking your optimizer's word for it, and optimizers reward noise as readily as signal.
It also complements the metrics you already track. Sharpe ratio, net profit, and max drawdown tell you how a strategy performed. Sensitivity testing tells you how much you should trust that performance. A backtest with a 2.1 Sharpe ratio means little if that number evaporates when you change a lookback period from 20 bars to 22.
Practical Methods: OAT, Grid Sweeps, Monte Carlo, and HPO
Four approaches dominate practical sensitivity testing, and each fits a different stage of research.
- One-at-a-time (OAT) testing. Hold every parameter fixed except one, then sweep that single value across a range. It's fast and easy to interpret, but it misses interaction effects between parameters entirely.
- Grid sweeps. Test every combination of every parameter across defined ranges. Exhaustive and reliable for low-dimensional spaces, but the combinatorial cost explodes fast. Five parameters at 20 values each means 3.2 million backtests.
- Monte Carlo or random sampling. Draw random combinations from your parameter space instead of testing every point. This scales far better in high-dimensional spaces, and coverage-based research on hyperparameter tuning has found that random sampling with enough draws often beats brute-force grids on compute efficiency.
- Hyperparameter optimization (HPO) methods, including tree-structured Parzen estimators (TPE), random search, and greedy search, target promising regions of the parameter space instead of sampling blindly.
Fix your random seed so results are reproducible.
Interaction Analysis: Reading Heatmaps and Interaction Plots
Testing parameters one at a time hides the interactions that actually break strategies. A stop-loss setting might look stable in isolation but only work in combination with a specific entry filter, and separating them in your test can produce a false sense of robustness.
Two-dimensional heatmaps solve this by plotting performance across two parameters at once, with color representing your target metric. What you look for:
- Diagonal bands of strong performance signal a real interaction. The parameters trade off against each other, and you need to tune them jointly.
- Horizontal or vertical bands mean the parameters behave independently. You can optimize them separately without losing accuracy.
- Isolated islands of high performance surrounded by poor results are the clearest overfitting warning in the entire toolkit.
Pro Tip: Add a third dimension with a contour or 3D surface plot when your top two parameters both show wide, flat interaction zones. A plateau that holds up across a broad 3D region is a far stronger robustness signal than a single 2D slice suggests.
Applied research on sensitivity analysis backs this up directly: interactions can make one setting effective only in combination with another, and ignoring that dependency risks a strategy that looks solid until live conditions separate the two.
Statistical Measures: Stability Scores, Gradients, and Bootstrap Confidence Intervals
Visual inspection gets you most of the way there, but numbers make your conclusions defensible. Three measures matter most.
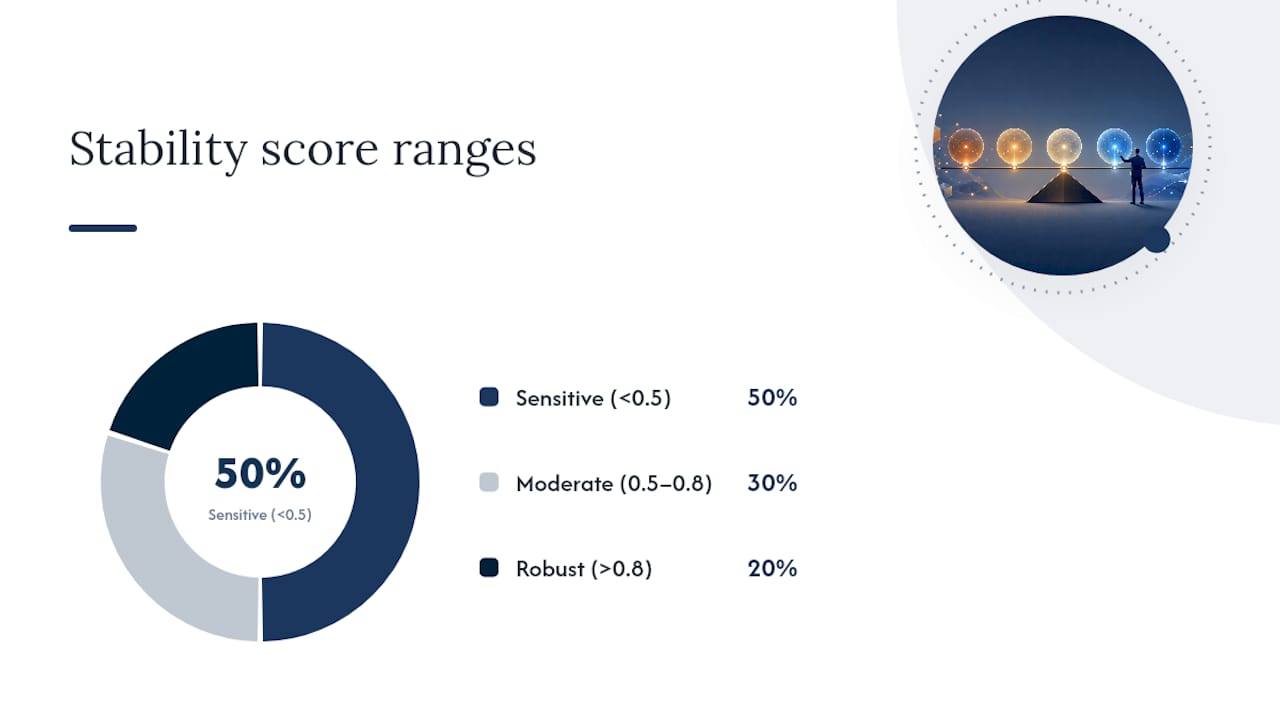
Stability score condenses sensitivity into a single number between 0 and 1, typically built from normalized variance and gradient measures across your tested range.
A common classification threshold: scores above 0.8 mean robust parameters, 0.5 to 0.8 mean moderate stability worth a closer look, and below 0.5 flags a sensitive parameter that likely won't survive live trading.
Variance and gradient work as the raw inputs behind that score. Variance shows how much your metric swings across the tested range. Gradient, the maximum slope between adjacent test points, catches cliffs that a smooth variance calculation might average away. Curvature adds a second layer, flagging whether you're sitting on a narrow peak or a broad plateau.
- Bootstrap confidence intervals quantify how much your stability estimate depends on sample size rather than true signal.
- A handful of test points can produce a stability score that looks robust purely by chance.
- Wider confidence intervals demand more sample points before you trust the classification; narrow, tight intervals from a well-sampled grid justify higher confidence in the result.
Best Practices and the Red Flags That Signal Overfitting
Range selection sets the ceiling on how much your test can reveal.
Cost modeling belongs in every sensitivity run, not just your final backtest. Commissions, slippage, realistic fills, and same-bar execution rules all shift where your stable zones actually sit. A parameter set that looks robust on frictionless fills can turn fragile once you price in realistic slippage on thin small-cap volume.
Regime testing closes the loop. Split your historical data across distinct market conditions, trending versus choppy, high volatility versus low, and confirm your stability classification holds across each split rather than just the full sample.
Watch for these red flags:
- A narrow performance peak surrounded by a steep drop-off on either side.
- High variance in your stability score across different time-period splits.
- A "sensitive" parameter tied to a strategy with a low total trade count, which usually means you're reading noise rather than signal.
The Workflow: Optimize, Test Sensitivity, Check Interactions, Validate Out-of-Sample
Follow this sequence to produce results you can actually defend when it's time to deploy capital.
- Set acceptance criteria first. Define your minimum trade count, maximum acceptable drawdown, and the confidence interval width you'll tolerate before you run a single test.
- Run OAT sweeps to identify which parameters drive the most variance in your target metric.
- Run targeted grid or HPO testing on the parameters OAT flagged as influential, watching specifically for interaction effects.
- Compute stability scores and bootstrap CIs, visualize results with heatmaps, and document your sampling methodology and seed values.
- Run walk-forward or out-of-sample validation across a different time period and market regime before you call the parameter set final.
| Stage | Output you need |
|---|---|
| OAT sweep | Ranked list of influential parameters |
| Grid/HPO test | Interaction heatmap, joint optimum |
| Statistical scoring | Stability score, bootstrap CI |
| Out-of-sample check | Confirmed performance on unseen regime data |
Skipping the last step is the single most common shortcut that turns a promising backtest into a losing live strategy.
Tools and Reproducible Implementations
You don't need proprietary software to run a rigorous sensitivity workflow, though the right platform saves significant setup time. Open-source Python frameworks handle backtesting logic and custom optimization loops well, and research notebooks remain the standard environment for exploratory grid and Monte Carlo work.
Whatever stack you use, build in these habits from the start:
- Fix random seeds for every Monte Carlo run so results reproduce exactly.
- Parallelize grid sweeps across cores; a 5-parameter grid at 20 values each easily takes days run serially.
- Checkpoint raw grid outputs to disk before generating plots, so a crashed visualization script doesn't cost you the underlying data.
- Consider surrogate models or early-stopping heuristics when your compute budget can't support an exhaustive sweep.
How Trade4 Puts Sensitivity Testing Into Practice
Trade-4's no-code backtester was built for exactly this workflow. Its visual pattern builder lets you sweep entry, exit, and risk parameters across defined ranges without writing loops, while tick-level historical data down to one second keeps your sensitivity results tied to realistic fills instead of smoothed daily bars.

For small-cap strategies specifically, Trade-4's news tagging and same-day re-entry analytics catch a failure mode generic backtesters miss entirely: event-driven microstructure that flips an apparently stable parameter fragile the moment a stock is in play. You can explore worked examples in the Trade4 blog.
What Small-Cap Sensitivity Testing Actually Teaches You
Two things surprise most traders the first time they run this analysis seriously. First, same-day re-entry rules interact with almost every other parameter in a small-cap gap strategy, which means testing entry filters in isolation gives you a misleading picture of stability. Second, a strategy that looks fragile on a narrow parameter grid often looks robust once you widen the search, because the true optimum was sitting just outside your original range.
Document every test you run, including the ones that fail. A reproducible record of what didn't work is worth as much as the parameter set that did.
— Romans
Run Your Sensitivity Tests Without Writing a Single Line of Code
Most sensitivity workflows stall at the implementation stage, not the analysis stage. Building parameter sweeps, interaction grids, and bootstrap confidence intervals in a notebook takes real engineering time most traders don't have to spare. Trade-4 removes that barrier: its visual builder lets you configure a full parameter sweep and re-run it across tick-level historical data in the same afternoon you'd otherwise spend debugging a Python loop.

The platform's granular filters, from gap percentage to volume thresholds, map directly onto the OAT and grid-sweep methods covered above, and its bucketed performance analysis surfaces stability patterns without extra scripting. If you're ready to see whether your own parameters hold up under real interaction testing, get started with Trade4 and run your first sensitivity sweep against your existing strategy.