
Include market impact in any backtest that trades nontrivial size or touches illiquid names, or your results will lie to you. Two approaches work in practice: analytic impact curves (linear or square-root) for fast portfolio scans, and order-book-walk replay when you need precision on microcaps or large-slice orders. This is why considering market impact matters before you trust a single equity curve.
TL;DR:
- Market impact models should be incorporated in backtests to avoid overstating capacity and underestimating trading costs, especially for large or illiquid trades.
- Impact consists of temporary and permanent components, with the former decaying after trading stops and the latter representing lasting information or inventory effects.
- Using simple models like linear or square-root impact is practical, but calibration must account for regime shifts, trading scale, and asset liquidity to improve accuracy.
- Order-book-walk replay provides precise impact measurement by simulating actual liquidity consumption, suitable for thin names and final capacity testing.
- Running backtests with impact models enabled and disabled helps gauge realistic cost drag and avoid overfitting, especially before live deployment.
Table of Contents
- Why Market Impact Matters: The Hidden Cost Anatomy
- Common Impact Models: Linear, Square-Root, Kyle's Lambda, and Almgren–Chriss
- How to Implement Market Impact in a Backtesting Engine
- Order-Book-Walk vs. Analytic Models: What You Gain and What It Costs
- Calibrating Impact Models: Getting the Coefficients Right
- Validation and Sensitivity Testing: Proving the Model Holds Up
- Microcap and Small-Cap Specific Considerations
- Trade4's Practical Workflow for Market-Impact-Aware Backtests
- Deployment Rules Once You Go Live
- Run Realistic Fills With Trade4 Backtester
- Technical Sources and Tools Worth Bookmarking
Why Market Impact Matters: The Hidden Cost Anatomy
Market impact is the price move your own order causes. It's not slippage from bad timing or a wide spread. It's the direct consequence of consuming liquidity, and it's inseparable from how much volume you trade relative to what's available. Ignore it, and your backtest measures a fantasy market that absorbs your orders for free.
Impact splits into two components that behave very differently. Temporary impact is the price concession you pay to get filled right now. It decays after you stop trading, as the book refills and other participants step back in. Permanent impact is the piece that sticks. It reflects the information your trade reveals, or the inventory imbalance you leave behind, and it doesn't revert. The Almgren–Chriss framework treats these as separate terms specifically because they respond to different levers. Temporary impact scales with how fast you trade; permanent impact scales with how much you trade.
This distinction feeds directly into implementation shortfall, the gap between the price you saw on your screen and the price you actually got. A backtest that ignores impact assumes every fill happens at the quoted price, no matter how many shares you push through.
Here's what breaks first when impact modeling is missing:
- Position sizing looks safe at any scale, because the backtest never punishes size.
- Capacity estimates come out wildly inflated, since nothing caps how much volume you can absorb per bar.
- Strategies that trade thin names look identical in performance to strategies that trade liquid large caps.
- Same-day re-entries appear costless, when in practice each re-entry into a name you just moved carries its own impact tax.
The square-root law offers useful intuition here: impact tends to grow roughly with the square root of your order size relative to available volume, not linearly. That nonlinearity is exactly why a strategy that looks great at $10,000 positions can degrade sharply at $100,000, and why capacity limits show up gradually rather than as a cliff.
Common Impact Models: Linear, Square-Root, Kyle's Lambda, and Almgren–Chriss
You have four practical starting points, and each one trades simplicity for accuracy differently.
-
Linear impact model. Cost is modeled as a constant coefficient times order size, often expressed as basis points per unit of participation rate. It's the easiest model to code and reason about, and it works reasonably well for small orders relative to average daily volume. Its weakness shows up fast at scale: a linear model overstates impact on very large orders and understates it on orders that push deep into a thin book, because it can't capture the accelerating cost of eating through successive price levels.
-
Square-root impact model. Impact is proportional to the square root of order size divided by average daily volume, typically written as impact = coefficient times the square root of (order size / ADV). This shape has strong empirical support across asset classes and underpins most institutional capacity calculations. Some research suggests a logarithmic relationship fits certain regimes better, which is a reminder that the "right" functional form is state dependent, not universal. Either way, the coefficient calibration matters more than the formula choice.
-
Kyle's lambda. This isn't a full impact model so much as a measurement concept: a regression coefficient describing how much price moves per unit of signed order flow. You estimate lambda by regressing price changes on net trade imbalance over a fixed window. A higher lambda means the name is less liquid and each dollar of buying or selling pressure moves the price more. Traders use Kyle's lambda as a cross-sectional liquidity ranking tool as much as a pricing input.
-
Almgren–Chriss. This model separates temporary and permanent impact explicitly and optimizes execution trajectory against a risk-aversion parameter, balancing market impact cost against timing risk from price volatility during the trade. It's the standard academic reference point for optimal execution, and most professional-grade impact models borrow its temporary/permanent split even when they don't use its full optimization machinery.
Because impact grows roughly with the square root of order size, there is a calculable crossing point where marginal impact cost equals your strategy's gross alpha per trade. That crossing point is your practical capacity ceiling. Get the square-root coefficient wrong by even a small margin, and your estimated capacity can be off by a meaningful multiple, which is exactly why calibration deserves more attention than model selection.
How to Implement Market Impact in a Backtesting Engine
Realistic cost modeling works as a three-layer stack, applied to every fill your engine generates:
- Commission. Fixed or per-share cost, straightforward and usually the smallest layer.
- Slippage. The gap between decision price and execution price from latency and short-term price movement, independent of your own footprint.
- Market impact. The cost your own order size creates, layered on top of the first two.
Most backtest engines expose this as separate hooks: a LinearImpact or SquareRootImpact function you attach to your order execution logic, alongside a commission model and a slippage model. This layered approach lets you isolate which cost component is actually driving your net returns down, rather than lumping everything into one fuzzy "transaction cost" number.
Applying impact correctly means working at two levels simultaneously. At the per-order level, you calculate impact based on that order's size relative to expected volume in the execution window, often expressed as a participation rate (order shares divided by bar volume). At the per-bar level, you adjust the fill price by the modeled impact amount before recording it in your equity curve.
Partial fill handling is where a lot of backtests quietly cheat. If your order required consuming more than a sensible share of a bar's volume, the engine should split the order across multiple bars rather than assume instant execution at one price.
Practical config knobs worth exposing in your setup:
- Participation cap (max % of bar volume per fill)
- Impact coefficient (calibrated per name or per liquidity bucket)
- Temporary impact decay rate (how fast the concession reverts)
- Permanent impact fraction (what portion of impact never reverts)
- Latency in milliseconds (time between signal and order arrival)
Pro Tip: Run every strategy twice, once with all three cost layers disabled and once with them fully enabled, before you trust any performance number. The gap between those two runs, your cost drag, tells you more about deployability than the Sharpe ratio ever will.
This is also where an event-driven backtest architecture earns its keep, since it processes fills bar by bar with state carried forward, rather than vectorizing returns across the whole series at once.
Order-Book-Walk vs. Analytic Models: What You Gain and What It Costs
Order-book-walk replay, often called L2 replay, works differently from any analytic formula. Instead of estimating impact from a coefficient, it consumes recorded order-book levels, one price tier at a time, and calculates a size-weighted average fill price based on exactly how much liquidity sat at each level when your order would have arrived. It doesn't estimate market impact; it measures it, using the same book depth a real order would have consumed.
That precision comes with real requirements:
- Full L2 snapshots with timestamps, not just top-of-book quotes
- Sufficient book depth history to cover your full backtest window
- Meaningfully more storage and compute than bar-based backtests, since you're replaying book state rather than reading a single price per interval
- Careful handling of latency between your signal and when your simulated order would actually reach the book
The accuracy payoff is substantial for the right use case. Analytic models estimate slippage from a formula; L2 replay reports the slippage you would have actually realized, level by level, including how much of your order would have gone unfilled if the book didn't have enough depth.
| Model type | Data granularity required | Compute cost | Accuracy tradeoff | Best fit |
|---|---|---|---|---|
| Analytic (linear/square-root) | Bar data (1-minute to daily) | Low | Higher bias, lower variance | Portfolio-wide scans, large-cap strategies |
| Order-book-walk (L2 replay) | Tick/L2 snapshots | High | Lower bias, higher variance across regimes | Microcaps, high-participation trades, capacity testing |
Use analytic curves when you're scanning hundreds of tickers for a first-pass strategy signal and speed matters more than precision. Switch to order-book-walk when you're testing a strategy on thin, low-float names, when your position size would represented a meaningful share of typical volume, or when you're finalizing capacity estimates before committing real capital. Tools like Wickra's impact backtester exist specifically because naive fill assumptions understate cost so badly on illiquid names.
Calibrating Impact Models: Getting the Coefficients Right
A model is only as good as its inputs, and impact coefficients are notoriously easy to get wrong.
-
Regress price moves on signed order flow to estimate Kyle's lambda. Take a window of trades, compute net buy versus sell volume imbalance, and regress subsequent price change against that imbalance. The resulting slope is your lambda for that name and period. Re-run this regression across multiple windows to see how stable the estimate is; a lambda that swings wildly between weeks tells you the name's liquidity regime is unstable.
-
Estimate the square-root coefficient using participation-rate variation. If you have historical trades at varying sizes relative to volume, plot realized impact against the square root of participation rate and fit the slope. Bootstrap this fit by resampling trades with replacement to get a confidence interval on your coefficient, rather than trusting a single point estimate.
-
Condition coefficients on regime, not just on the ticker. Impact coefficients aren't static properties of a stock. They shift with volatility, time of day, and prevailing liquidity. A coefficient calibrated on calm midday trading will understate impact during the first fifteen minutes after the open or during a volatility spike. Bucket your calibration data by volatility regime and time-of-day window, then apply the matching coefficient set rather than one blended average.
-
Re-calibrate on a walk-forward cadence, not once at setup. Liquidity conditions drift. A coefficient set that fit last quarter can be stale this quarter, particularly after a stock's float changes, a major index inclusion, or a period of unusual news flow. Rolling recalibration every few weeks, cross-validated against out-of-sample fills, catches drift before it silently degrades your live results.
Coefficient calibration is state dependent by nature; the "right" number for a mega-cap during a calm session and the "right" number for a microcap during an earnings gap can differ by an order of magnitude. Treat every calibrated coefficient as provisional, tied to the regime it was measured in, not as a permanent property of the ticker.
Validation and Sensitivity Testing: Proving the Model Holds Up
A model that looks clean on paper still needs to survive contact with skepticism. Four checks belong in every serious validation pass:
- Run the identical backtest with and without cost layers enabled, then compute the difference in net return. This cost drag figure is the single clearest signal of how dependent your strategy's apparent edge is on ignoring execution reality.
- Use Monte Carlo simulation to stress different fill-price paths within your modeled uncertainty range, rather than trusting one deterministic run.
- Apply block-bootstrapping by resampling contiguous chunks of your trade sequence to check whether results depend on a handful of lucky trades clustering together.
- Run walk-forward analysis, calibrating on one period and testing on the next, unseen period, to catch parameter sets that were quietly overfit to a specific stretch of history.
Reporting matters as much as the tests themselves. A tearsheet that only shows net returns hides the story; show gross returns, net returns, cost drag as a percentage, and an explicit capacity estimate side by side. If your walk-forward verdict shows performance holding up out-of-sample while cost drag stays proportionally consistent, that's a strategy worth taking seriously. If net returns collapse the moment costs enter the picture, the strategy was never really profitable, it was just untested. Backtesting entry and exit logic with walk-forward and Monte Carlo methods side by side catches most of the overfitting that a single clean backtest run will hide.
Microcap and Small-Cap Specific Considerations
Microcap and nanocap names carry a different risk profile entirely. Low float and thin daily volume mean large orders routinely get only partially filled, and price swings on modest order flow are common. A backtest that assumes full fills at the modeled price on these names is almost certainly overstating what's achievable.
Model partial fills honestly, using fill probabilities tied to order size relative to typical volume, and calculate a partial VWAP rather than assuming a single clean execution price.
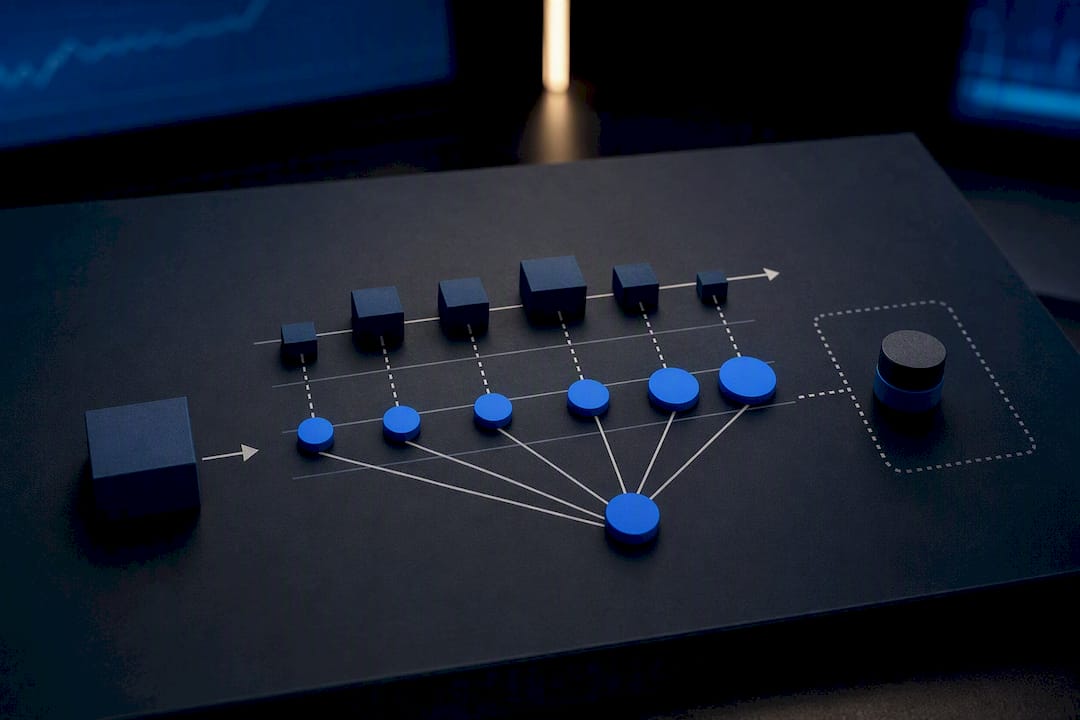
Keep participation caps conservative on these names, tighter than you'd use for a liquid large cap, and test scale-up in stages rather than jumping straight to full intended size. What works at 500 shares can behave completely differently at 5,000.
News events deserve their own tag. A gap-and-go setup that triggers on a press release behaves very differently from the same technical setup on a quiet day, because liquidity floods in and out around news in ways ordinary volume patterns don't predict. Tagging news events in your backtest data lets you separate "this strategy works" from "this strategy only worked because of one catalyst-driven liquidity spike," which matters enormously when evaluating same-day re-entry behavior after a stock has already moved.
Pro Tip: If a name's average daily volume can't comfortably absorb your intended position size within your target participation cap, that's your answer on automation. Either size down, walk the order manually, or skip the trade, don't let the backtest convince you a thin name will behave like a liquid one.
Trade4's Practical Workflow for Market-Impact-Aware Backtests
Some backtesting platforms address this problem by giving small-cap traders no-code ways to run the workflow described above without hand-coding an impact engine from scratch. A few features map directly onto what this guide covers:
- Tick-to-second granularity lets you model fills at a resolution fine enough to catch the liquidity crunches that daily or minute bars smooth over.
- News tagging and analysis separates catalyst-driven trades from ordinary setups, which is essential for honest microcap evaluation.
- Same-day re-entry analytics measure exactly the re-entry impact tax that flat backtests miss entirely.
- Multi-run job queues let you run gross-versus-net A/B comparisons and sensitivity sweeps in parallel instead of one at a time.
The suggested sequence: calibrate your coefficients on a liquidity bucket you actually trade, run an A/B cost-drag comparison to see what your edge looks like once execution reality enters the picture, sweep participation rates to find your practical capacity ceiling, then validate with a walk-forward test before committing capital. Traders pairing output from backtesting platforms with a third-party analytics layer like TP Scanner get an added check on trade quality before scaling size.
Deployment Rules Once You Go Live
Backtests, no matter how carefully built, are approximations. The gap between modeled and live fills is where most strategies quietly fail, and closing that gap is a discipline, not a one-time task.
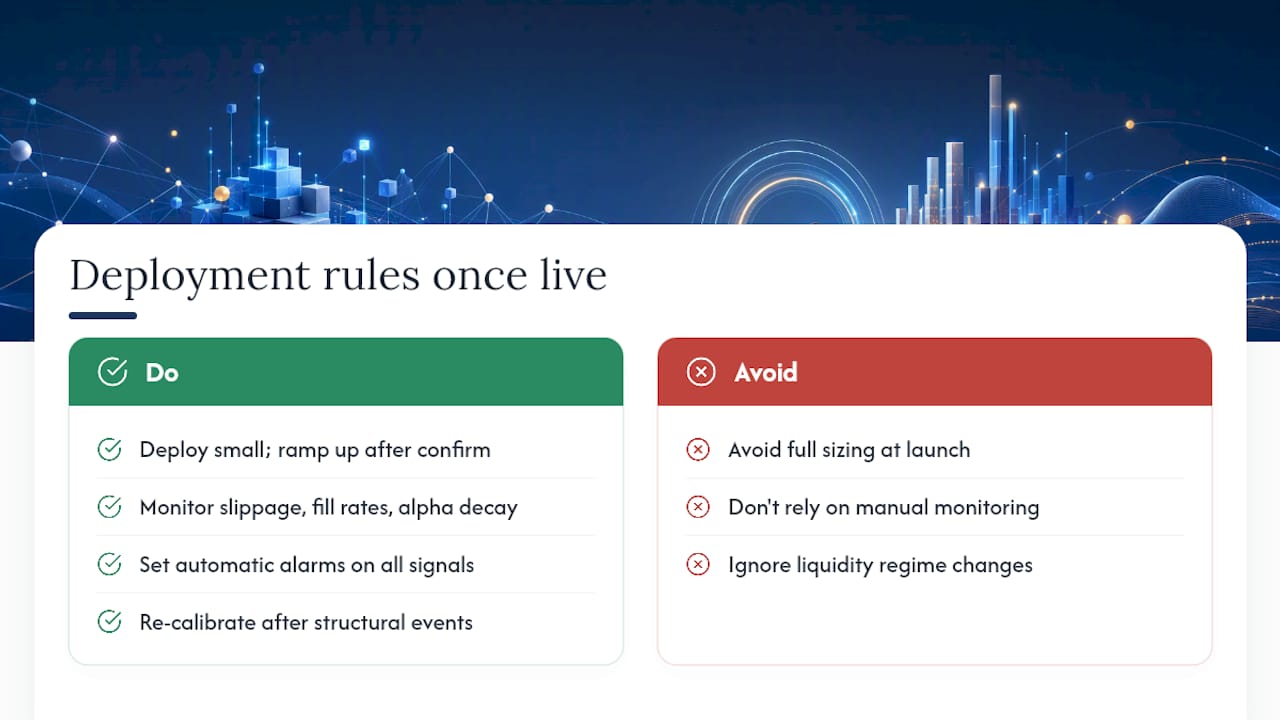
Start small. Deploy at a fraction of your backtested position size and ramp up only as live fills confirm your impact assumptions were reasonable, not optimistic. Watch three signals continuously: realized slippage versus modeled slippage, actual fill rates versus assumed fill rates, and any sign of alpha decay as more capital chases the same setup. Set automatic alarms on all three, because manual monitoring misses drift until it's already expensive.
Re-calibrate after any structural event, a float change, an index addition, a period of unusual news flow, because your coefficients were fit to a liquidity regime that may no longer exist. And keep a conservative safety margin between your backtested capacity and your deployed size. The margin isn't wasted capital; it's the buffer between a model that worked in history and a market that hasn't read your backtest.
— Romans
Run Realistic Fills With Trade4 Backtester
Modeling market impact by hand means writing your own participation caps, partial-fill logic, and coefficient regressions before you've tested a single strategy idea. Trade4 gives small-cap traders that infrastructure already built into a no-code interface, with tick-to-second data, news tagging, and same-day re-entry analytics ready to run without a line of code.

Configure a strategy in the visual pattern builder, run it once with cost layers off and once with them on, and compare the two equity curves side by side to see your real cost drag. The Trade4 Backtester handles the participation caps and fill logic described throughout this guide automatically, so you spend your time interpreting results instead of debugging simulation code. Head to the getting-started guide to configure your first market-impact-aware backtest today.
Technical Sources and Tools Worth Bookmarking
A few references are worth keeping on hand as you build out impact-aware backtests:
- Open-source backtest engine documentation covering commission, slippage, and market impact hooks, useful for seeing how
LinearImpactandSquareRootImpactare implemented in practice. - Order-book-walk and L2-replay project documentation for understanding size-weighted fill price mechanics.
- Explainers on the square-root law and the Almgren–Chriss framework for the theoretical grounding behind capacity and execution-cost estimates.
- Trade4's blog library for walkthroughs on penny stock backtesting and gap short strategy testing on small-cap names.