
Volatility regime backtesting labels historical market states by volatility level, then measures strategy performance separately within each one. The point is to expose fragility that an aggregate backtest hides. Run a stratified return breakdown by volatility bin, or a rolling walk-forward test, before you trust any equity curve.
TL;DR:
- Proper regime labeling requires smoothing and avoiding rapid flips to prevent misclassification and false signals.
- Strategies need enough data in each regime cell, with minimum trading days, to produce statistically meaningful performance metrics.
- Transaction costs and slippage should be modeled separately for each regime since they vary with volatility levels.
- Stratified results often reveal weaknesses in high or low volatility regimes that aggregate metrics can obscure.
- Reliable backtesting demands avoiding lookahead bias, survivorship bias, and microstructure mismatches to prevent misleading conclusions.
Table of Contents
- What Is Volatility Regime Backtesting, and Why Does It Matter?
- How Do You Classify Volatility Regimes?
- How Do You Design a Regime-Aware Backtest?
- What Should Be on Your Implementation Checklist?
- How Do You Report Regime-Conditional Results?
- What Pitfalls Invalidate a Regime Backtest?
- How Trade4 Supports Regime-Aware Backtesting
- Is Your Strategy Actually Ready for Live Capital?
- Try Regime-Aware Backtesting on Trade-4
What Is Volatility Regime Backtesting, and Why Does It Matter?
A single backtest number, one Sharpe ratio over five years, tells you almost nothing about how a strategy behaves when the market changes character. Volatility isn't one thing. Realized volatility measures what already happened; implied volatility reflects what options markets expect; instantaneous volatility (the kind GARCH models estimate) captures the current state of a constantly shifting process. Markets also cluster their volatility, calm stretches followed by violent ones, which is exactly why a strategy that looks great in a five-year in-sample window can be quietly living off one regime's behavior.
That's the core problem regime-aware testing solves. Markets are nonstationary, so a single in-sample window can mask serious weaknesses that only show up when the volatility environment shifts. Certain strategy types feel this more acutely than others:
- Mean-reversion setups, which tend to break down in trending, high-volatility regimes
- Momentum and breakout strategies, which often underperform in low-volatility, range-bound conditions
- Gap and reversal plays on small caps, where volatility clustering can compress or explode entry/exit timing within days
How Do You Classify Volatility Regimes?
Before you can test performance by regime, you need a reliable way to label one. Three approaches dominate practice, each with a different tradeoff between precision and simplicity.
- Parametric models (the GARCH family). GARCH(1,1) and its variants model volatility as a function of past shocks and past variance, producing a continuous forecast you can bucket into "low," "medium," and "high" regimes. It's the standard academic and industry approach for volatility forecasting because it adapts quickly to new shocks.
- Statistical classifiers: HMM and GMM. Hidden Markov Models and Gaussian Mixture Models treat regimes as hidden states and output probabilities of being in each one, rather than a hard label. This gives you soft transitions instead of a jarring flip from "calm" to "stressed" overnight, but it requires more data and more careful tuning to avoid overfitting the number of states.
- Rolling percentile or threshold labeling. The simplest method: rank trailing realized volatility (say, a 20-day or 60-day window) against its own historical percentiles and assign a bin. It's transparent and easy to audit, though it reacts slower to regime shifts than a parametric model.
Latency matters more than most quants expect. A regime label that flips every few days because of noise, rather than a genuine shift, will scramble your stratified results and make every bucket look artificially unstable.
Pro Tip: Smooth your regime labels with a minimum dwell time (e.g., a regime must persist five trading days before it "counts") before you feed them into a stratified backtest. It cuts label churn dramatically without sacrificing responsiveness.
How Do You Design a Regime-Aware Backtest?
Start by defining your regime axes and their resolution. Most practitioners use two to four volatility bins (low, medium, high, or low/medium/high/extreme), and a second axis, often trend direction, adds real value when a single volatility label leaves too much heterogeneity unobserved. Combining volatility with trend expands your grid to six or nine regime cells and can surface conditional edges a one-dimensional view misses entirely.
Coverage is where most regime backtests quietly fail. Every cell needs a minimum number of observed trading days before its Sharpe ratio means anything statistically. A widely cited floor is a minimum number of trading days per cell, with stricter deployments demanding significantly more days before trusting the number for live capital.
- Map every historical day to a regime cell using your chosen classifier
- Count observations per cell and flag any cell below your N_min threshold
- Require at least a nonnegative cell-level Sharpe before treating a regime as "cleared"
- Use rolling or walk-forward windows, training on one period, testing on the next, so your out-of-sample results reflect real regime transitions rather than lookahead luck
When a regime is legitimately rare in your available history (a genuine volatility crisis, for instance), you have three honest options: extend your data history further back, synthesize regime-specific paths through Monte Carlo methods, or explicitly mark the cell as uncovered and refuse to certify the strategy for that condition. Each choice carries a tradeoff. Extending history risks mixing in an earlier market microstructure era; synthesis risks baking in whatever assumptions generated the paths. Report which one you used.
What Should Be on Your Implementation Checklist?
Getting the regime labels right is only half the job. The backtest underneath them needs to be honest about data, costs, and process, or the stratified results will just be precise-looking noise.
- Choose your frequency and realized-vol estimator deliberately. Daily realized volatility is fine for swing strategies; intraday realized volatility (built from 1-minute or even 1-second bars) is necessary if your entries and exits happen within a session, since small-cap gap and reversal setups can shift regime within a single trading day.
- Model transaction costs, fills, and slippage per regime, not as a flat average. Market impact and slippage typically widen in high-volatility regimes precisely when your strategy is most exposed, so a single blended cost assumption will overstate performance in the cells that matter most.
- Guard against label leakage. Compute every regime label using only information available at that point in time. A GARCH fit re-estimated on the full sample and then applied backward is a classic and easy-to-miss form of lookahead bias.
- Build a deterministic, versioned pipeline. Seed your random number generators, version your regime-labeling code, and log the exact parameters used for each run. A "close enough" rerun that produces a different Sharpe by cell isn't a backtest you can defend.
Pro Tip: Run the same regime-labeling code on a held-out slice of data you haven't looked at yet, before finalizing your strategy parameters. If your regime boundaries shift meaningfully, your labeling method is too sensitive to the exact sample.
How Do You Report Regime-Conditional Results?
Aggregate metrics tell you almost nothing on their own once you've done the work of splitting by regime. Report performance cell by cell: Sharpe ratio, Sortino ratio, CAGR, maximum drawdown, and recovery time, each computed within the regime rather than blended across all of them.
- Build regime-labeled equity curves so a reader can see exactly where the strategy gained or lost ground
- Generate a heatmap of Sharpe or CAGR across your regime grid to spot which cells carry the strategy and which drag on it
- Layer trade maps on top, showing individual trade outcomes color-coded by regime, to catch clustering that summary statistics smooth over
Bootstrap confidence bands around each cell's Sharpe ratio matter as much as the point estimate itself. A cell built on 260 trading days will have a much wider confidence band than one built on 1,500, even if the raw Sharpe numbers look identical.
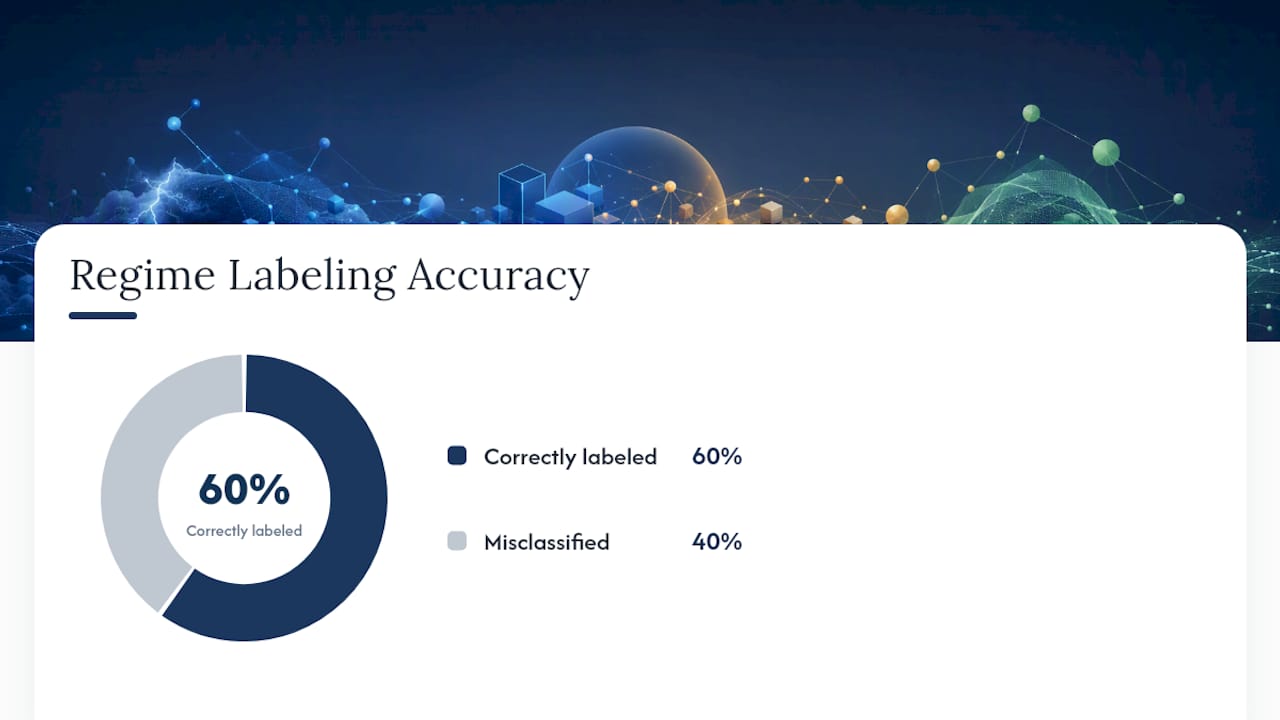
Two of five volatility-regime labels were later found to be misclassified in one backtest of a market regime detector, a reminder that even well-built classifiers can mislabel a meaningful share of history, and that intuitive playbook rules (like "long volatility always wins in high-volatility regimes") don't hold up under stratified, statistically tested scrutiny.
When your aggregate Sharpe looks strong but one or two regime cells show negative or barely-positive performance, trust the stratified view. The aggregate number is often just the calm-regime performance diluted by a few bad quarters, not a genuine average of how the strategy behaves everywhere.
What Pitfalls Invalidate a Regime Backtest?
Most regime backtests fail quietly, not loudly. A handful of specific errors account for the majority of misleading results.
- Lookahead and label leakage: fitting regime classifiers on the full dataset and applying them retroactively. Fix it by refitting classifiers on expanding or rolling windows only.
- Sample selection and survivorship bias: testing only on symbols that still exist today, which quietly filters out the volatility events that killed weaker names.
- Era and microstructure mismatches: extending history into a period with different tick sizes, decimalization rules, or liquidity profiles can make an "extended" regime cell misleading rather than helpful.
- Overfitting to the dominant regime: a strategy tuned during a long calm stretch will look brilliant in aggregate and fragile the moment you check its stratified overfitting behavior against a stress regime.
How Trade4 Supports Regime-Aware Backtesting
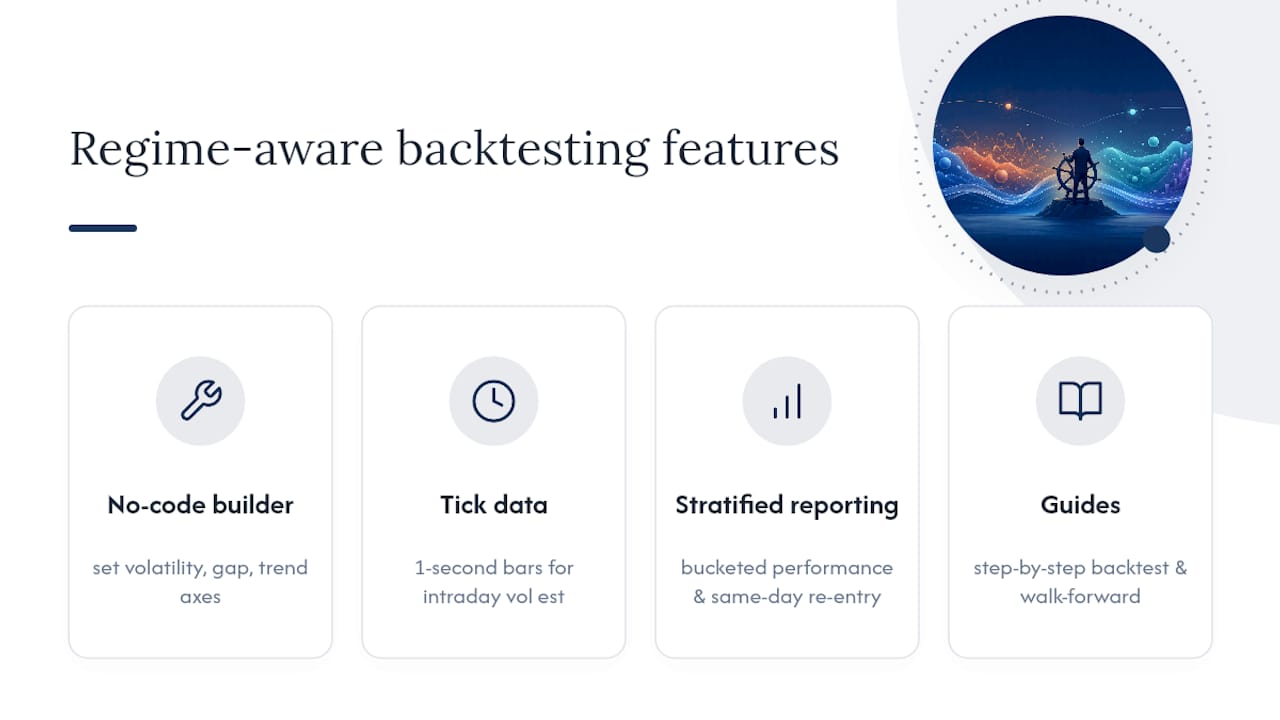
A no-code pattern builder lets you set up volatility, gap, and trend filters as regime axes without writing classifier code by hand. Tick-level historical data, down to one-second bars, supports the intraday realized-vol estimation that daily-only data can't provide. Bucketed performance analysis and same-day re-entry analytics can map directly onto stratified reporting by regime cell. For a hands-on walkthrough of building and running a test, Trade-4's step-by-step backtest guide covers the workflow end to end, and the walk-forward validation guide details rolling out-of-sample structure.
Is Your Strategy Actually Ready for Live Capital?
A simple rule: don't deploy until every regime cell has adequate coverage and at least a nonnegative Sharpe, or the negative cells fall within a risk budget you've explicitly accepted. Delay deployment whenever a crisis-level volatility cell is uncovered or shows a severely negative cell-specific Sharpe. Test results that only look good in aggregate are not test results you can trust with real money.
— Romans
Try Regime-Aware Backtesting on Trade-4
Every checklist item in this guide, regime coverage, rolling walk-forward structure, stratified reporting, cost modeling, requires a backtester built for granular data rather than daily-bar approximations. The backtester is built for that job: a no-code visual pattern builder, historical bars down to one second, and bucketed performance metrics that break results down by regime cells you define, without a line of Python.

If you're testing small-cap gap or reversal setups where volatility regimes can flip within a session, coarse daily data will hide the exact fragility you're trying to find. Trade-4's re-entry analytics case study shows the workflow on a real gap-short setup. Start with the getting-started guide to set up your first regime-stratified test, or go straight to the Trade-4 backtester and run your own strategy against the volatility bins that matter for your book.