
Re-entry backtesting is worth doing, but only when it accounts for the true cost of stacking trades. Test a re-entry rule with realistic slippage, a proper profit factor calculation, and walk-forward analysis, and you find out fast whether it recovers lost trades or just multiplies losing ones. Skip those checks, and you're trusting a number that isn't real. The sections below walk through exactly how to build that test.
TL;DR:
- Re-entry backtesting must include realistic slippage, commissions, and spread costs for each attempt to reflect true trading conditions.
- Data resolution should be intraday or tick-level to accurately simulate re-entry triggers and fills, especially within the same trading session.
- Cost modeling must be rigorous, with actual broker commissions, spread, slippage, and cumulative costs tracked across multiple re-entry attempts.
- Validation requires out-of-sample testing, walk-forward analysis, and stress tests to ensure the re-entry rule performs consistently and is not overfitted.
- No-code tools like Trade4 enable visual, high-resolution re-entry backtesting with cost, frequency, and performance analytics without coding.
Table of Contents
- What Is Re-Entry Strategy Backtesting?
- How Do You Prepare Data and Costs for a Re-Entry Test?
- How Do You Encode Re-Entry Rules for a Backtest?
- How Do You Validate That a Re-Entry Rule Actually Works?
- Which Tools Fit a Re-Entry Backtest Best?
- How Trade4 Handles Re-Entry Backtesting Without Code
- When Does a Re-Entry Strategy Actually Make Sense?
- Run a No-Code Re-Entry Backtest Before You Risk a Dollar on It
- Further Reading on Backtesting Methodology
- FAQ
What Is Re-Entry Strategy Backtesting?
Re-entry backtesting evaluates whether getting back into a position after an exit, whether that exit was a stop-out, a profit target, or a scratch trade, adds value once you account for every added cost. That's the core claim worth testing before you ever risk capital on it: re-entry rules only earn their place in a system when the historical simulation includes the same slippage, commissions, and spread that would have hit a live account on every single attempt, not just the first one.
Traders build re-entry logic in a handful of common shapes. Immediate re-entry fires right after a stop-out if the original setup condition still holds. Delayed re-entry waits a fixed number of bars or for a confirmation signal before trying again. Laddered re-entry stacks multiple smaller positions at pre-set price levels as a move develops. Scale-in re-entry adds to a winning position once it clears a certain threshold, effectively pyramiding size onto strength.
You'll see these show up in a few recurring situations:
- Trend continuation setups where a pullback stops out the first attempt but the underlying move resumes
- Stopped-out recoveries on small-cap runners that fake a reversal before continuing the original direction
- Intraday reversal plays where the first entry is early and a second, better-timed entry captures the real move
The upside is real: a well-built re-entry rule can turn a strategy with mediocre win rate into one with a materially better expectancy, because it's effectively giving your original thesis a second and third chance to play out. The risk sits on the other side of that same coin. Every added re-entry attempt adds another round of commissions and spread, and on a strategy that already trades often, those costs compound fast. Worse, a re-entry rule with three or four tunable parameters (delay bars, price offset, volume filter, max attempts) is exactly the kind of setup that curve-fits to noise in a historical sample instead of capturing a real, repeatable pattern.
How Do You Prepare Data and Costs for a Re-Entry Test?
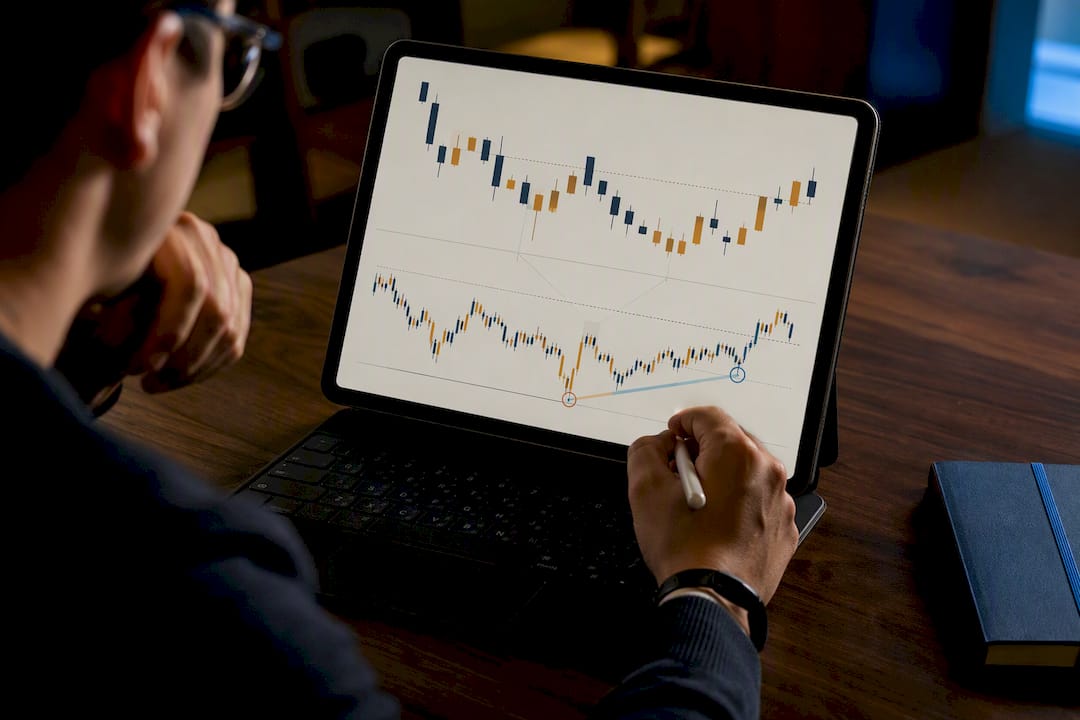
Re-entry strategies live or die on data resolution. A strategy that re-enters within the same session needs minute or tick-level bars, not daily closes, because a daily bar hides the exact sequence of stop-out and re-trigger that actually happened intraday. If your re-entry logic depends on a specific price level being touched and then reclaimed within minutes, testing on daily data will hand you a backtest that looks nothing like what a live execution would have produced.
Point-in-time, survivorship-free data matters just as much. Small-cap and micro-cap universes lose names to delistings, reverse splits, and halts constantly, and a dataset that quietly drops those tickers will inflate your results by testing only on stocks that survived. Include the delisted names and the failed runners, or the backtest is measuring a universe that never existed in real time.
Cost assumptions need the same rigor:
- Set commission per trade based on your actual broker schedule, not a round number that flatters the results.
- Model spread as a real cost on every entry and every re-entry, since re-entry strategies by definition cross the spread more often than single-entry systems.
- Add slippage per attempt, and consider stress-testing it at 50% worse than your baseline assumption to see how fragile the edge really is.
- Track cumulative cost per trade sequence, not just per individual fill, so you can see the compounding effect across a full re-entry chain.
A conservative sample-size target: aim for a sufficient number of trades before you trust a re-entry backtest's metrics. Fewer than several dozen trades is closer to noise than to a signal. For every trade, log the entry price, re-entry trigger reason, fill price, slippage realized, commission paid, holding time, and exit reason. That log becomes your diagnostic tool when a strategy that looked great in aggregate starts to fall apart under closer inspection.
How Do You Encode Re-Entry Rules for a Backtest?
Ambiguity is the enemy of an honest backtest. A re-entry rule that says "re-enter if the setup still looks good" isn't testable. A rule that says "re-enter at market within 3 bars of stop-out if price reclaims the 9-EMA on volume above 1.5x the 20-bar average" is. Every re-entry rule needs to specify four things without exception: the trigger condition, the timing window, the fill assumption, and the maximum number of attempts allowed before the system stands down.
A basic re-entry blueprint reads something like this in pseudo-code logic:
- On stop-out, start a countdown of N bars during which re-entry is eligible.
- Check the re-entry trigger condition on each new bar close within that window.
- If triggered, simulate a fill using either a market order (fill at next bar open plus slippage) or a limit order (fill only if price trades through the limit level, with a partial-fill check against bar volume).
- Cap re-entries at a fixed maximum, and define a hard cutoff (end of session, end of day, or a set number of bars) after which no further attempts are allowed.
- If using an OCO bracket on the re-entry, model both the stop and target as live orders that can fill in the same bar, and decide in advance which one wins in that ambiguous case.
Intrabar assumptions matter more for re-entry testing than almost any other part of the process, because a re-entry that triggers and fills within the same bar is exactly where optimistic backtests go wrong. If your data doesn't have tick or sub-minute resolution, you're forced to guess at what happened inside that bar, and guessing tends to favor the strategy. Simulating partial fills based on a percentage of that bar's volume, rather than assuming the whole order filled instantly, keeps the test honest.
Manual, candle-by-candle replay still has a place here, especially early in development. Walking through a chart bar by bar and manually deciding whether the re-entry rule would have triggered forces you to confront edge cases that a script might silently mishandle, and it's a strong way to catch look-ahead bias before it contaminates the whole test. Once the rule is solid, moving to a scripted or automated backtest engine lets you scale that same logic across hundreds of tickers and years of history in a fraction of the time, which is where you actually get the trade count needed for statistical relevance.
Pro Tip: Always model re-entry fills conservatively rather than optimistically, and log re-entry frequency and cumulative cost per trade sequence separately from your headline profit numbers. A strategy can show a strong profit factor overall while its re-entry attempts specifically are bleeding money, and you'll only catch that if the log breaks the two apart.
How Do You Validate That a Re-Entry Rule Actually Works?
Out-of-sample testing is the first checkpoint. Split your historical data into an in-sample period, where you build and tune the re-entry rule, and a completely separate out-of-sample period the rule never touched during development. If performance collapses on the untouched data, the rule was fit to noise in the training window rather than capturing a repeatable behavior.
Walk-forward analysis takes that a step further by rolling the split forward through time. You optimize on window A, test on window B, then roll both windows ahead and repeat, recording performance for each fold along the way. A re-entry rule with a genuine edge tends to show median profitability across most folds. A rule that only works in one lucky stretch is a strong sign of over-optimization, and limiting the number of tunable parameters in the first place is the most direct defense against that trap.
Monte Carlo and block-bootstrap testing round out the validation. Shuffling the order of trades and re-running the equity curve thousands of times shows you the range of outcomes your strategy could plausibly have produced by chance alone. Stress-testing slippage by pushing it well beyond your baseline assumption tells you how much of the edge depends on cost assumptions holding up exactly as modeled.
Set clear thresholds before you look at results, not after:
- Require a minimum of 100+ trades in the full backtest before treating any metric as reliable.
- Look for a profit factor comfortably above 1, not just barely positive.
- Confirm the out-of-sample Sharpe or Sortino ratio holds up reasonably close to the in-sample figure.
- Require median profitability across walk-forward folds, not just an average pulled up by one strong stretch.
- Move to forward testing only after the rule clears these thresholds, and plan to accumulate 30+ live or simulated trades over several weeks before trusting execution assumptions in real conditions.
| Validation method | What it detects |
|---|---|
| Out-of-sample split | Whether the rule was fit to the training data specifically |
| Walk-forward analysis | Parameter stability and over-optimization across rolling windows |
| Monte Carlo / trade-shuffle | Sensitivity to trade sequence and the role of luck |
| Slippage stress test | Fragility of the edge to worse-than-expected execution costs |
| Forward test (30+ trades) | Whether live conditions match backtest assumptions |
Which Tools Fit a Re-Entry Backtest Best?
The right workflow depends less on preference and more on what your re-entry logic actually needs to see. A rule that triggers off a 20-day moving average crossover can run comfortably on daily bars in a spreadsheet prototype. A rule that re-enters within the same five-minute window after a stop-out needs intrabar fidelity that a spreadsheet simply can't model.
Manual replay is slow but forces you to see every edge case firsthand, which makes it valuable for the first pass on a discretionary idea. Spreadsheet prototypes work for simple, low-frequency re-entry logic where intrabar behavior doesn't matter much. Script-based backtest engines, built with frameworks like Backtrader or Zipline, give you full control over order and fill modeling, which matters enormously once re-entry timing gets specific. Vectorized libraries like VectorBT trade some of that fill-level precision for speed, letting you sweep thousands of parameter combinations to see how sensitive your re-entry rule is to small changes in delay, price offset, or volume filter.
Before picking a workflow, run through this checklist:
- Does your data source provide the resolution your re-entry timing actually requires, tick, minute, or daily?
- Does the tool model partial fills and order type (market, limit, OCO) or assume unrealistic instant execution?
- Can you run a large enough parameter sweep to test sensitivity without weeks of compute time?
- Can you or someone else reproduce the exact same result from the same rule definition a year from now?
If you want a deeper walkthrough of manual versus automated approaches, Trade4's guide on how to backtest a trading strategy step by step covers both in more detail, and the tick data backtesting guide is worth a read before you commit to a data resolution.
How Trade4 Handles Re-Entry Backtesting Without Code
A practical re-entry workflow on Trade4 starts in the visual pattern builder, where you encode the trigger condition, timing window, and maximum attempts for a re-entry rule without writing a line of code. Run that rule against tick-accurate historical data, from one-minute bars down to one-second resolution, and Trade4 surfaces re-entry frequency and cumulative cost impact right alongside your standard performance metrics, so you see immediately whether the extra attempts are adding expectancy or just adding cost.
A few features address the risks covered throughout this guide directly:
- High-resolution historical data down to one-second bars for intrabar-sensitive re-entry timing
- Built-in slippage, commission, and spread modeling applied per attempt, not just per strategy
- News tagging and analyzer to flag whether re-entry signals are firing around news-driven volatility
- Same-day re-entry analytics that break out same-session re-entry performance separately from multi-day holds
For a hands-on walkthrough of building your first rule set, Trade4's entry and exit rules with walk-forward and Monte Carlo guide and the broader Trade4 blog cover the same validation steps outlined above in platform-specific detail.
When Does a Re-Entry Strategy Actually Make Sense?
Re-entry earns its complexity on liquid small-cap runners and setups with a clear, repeatable regime edge, where a stopped-out trade genuinely has a good chance of resuming. It rules itself out fast for many discretionary traders once you weigh the operational load: extra screen time, extra decision points under pressure, and the psychological pull to chase a loser back in.
The simplest decision rule I'd apply: don't add re-entry logic to a system unless a backtest built with conservative costs and walk-forward validation clears the same thresholds you'd demand of any strategy, 100+ trades, a solid profit factor, and stable out-of-sample performance. If it can't pass that bar in simulation, it has no business running with real money attached to it.
— Romans
Run a No-Code Re-Entry Backtest Before You Risk a Dollar on It
There are alternatives to writing your own backtest engine when you need to test a re-entry rule quickly rather than spending a long time coding order-fill logic and slippage models from scratch. Configure your re-entry trigger in a visual pattern builder, run it against historical data, and inspect the re-entry frequency and cost breakdown automatically, without programming or manual trade logging.

Such a workflow can handle cost modeling, sample-size tracking, and same-day re-entry analytics as discussed, to enable testing with greater rigor than rough spreadsheet estimates. If you trade small-cap runners specifically, the gap short strategy backtest guide shows a related workflow worth reviewing first. Head to the Trade4 getting-started page and run your first re-entry sweep on real historical data today.
Further Reading on Backtesting Methodology
For deeper technical background on the concepts covered above, QuantStart's work on successful backtesting of algorithmic trading strategies and slippage modeling, along with QuantInsti's guidance on avoiding common backtesting mistakes, remain solid starting points for traders building their own validation process.
FAQ
What Is the 3-5-7 Rule in Trading Strategy?
The 3-5-7 rule is a position-sizing guideline suggesting no single trade risks more than 3% of capital, no total open exposure exceeds 5%, and no correlated group of trades exceeds a modest combined risk. It's a risk-management convention rather than a backtested statistical finding, so treat it as a starting framework, not a rule proven by re-entry data.
What Is the Best Backtested Trading Strategy?
There's no single best strategy; the strongest backtested approach is whichever one clears realistic cost assumptions, hits 100+ trades, and holds up across out-of-sample and walk-forward testing. A strategy that looks strongest on a single in-sample run is often the least reliable one once tested this way.
Can ChatGPT Backtest a Trading Strategy?
ChatGPT can help you write pseudo-code, structure re-entry logic, or draft a script for a backtesting framework, but it cannot execute historical price data or run a real simulation on its own. You still need a data source and an execution engine, whether that's a coded framework or a no-code platform like Trade-4, to actually run the test.
What Is the Best Way to Backtest a Trading Strategy?
The most reliable process defines unambiguous rules, applies them bar-by-bar to point-in-time historical data with realistic costs, then validates results with out-of-sample testing, walk-forward analysis, and Monte Carlo resampling before ever trading it live. Skipping the validation step is the single most common reason backtested strategies fail once they hit real markets.