
A backtest is statistically significant only when it clears both a single-test threshold and a selection-adjusted or resampling check. If it only clears the first, you're probably looking at noise wearing a costume.
Here's the fast version before we get into the mechanics:
- For one pre-specified test, a t-stat around 2 is the conventional bar indicating statistical significance at a commonly accepted confidence level.
- After you've run dozens or hundreds of variants, that same t-stat means almost nothing until you adjust for how many trials produced it.
- Four pillars uphold a real significance claim: classical inferential tests, sufficient sample size and power, multiple-testing corrections, and resampling combined with out-of-sample validation.
Pro Tip: If you can't say how many parameter combinations you tested before landing on the "winning" one, you don't yet have a significance result. You have a number.
Key Takeaways
A backtest result only counts as statistically significant once it survives selection-adjusted metrics like DSR or PBO and holds up under resampling and walk-forward testing, not a single p-value alone.
| Point | Details |
|---|---|
| Single tests aren't enough | A t-stat near 2 only means something for one pre-specified test, not for the best of many trials. |
| Track every trial | Log all tested configurations, not just winners, so DSR and PBO calculations reflect real trial counts. |
| Use block-preserving resampling | Permutation tests and block bootstrap should preserve autocorrelation to build a realistic null. |
| Walk-forward proves persistence | Rank stability and overfit ratios across rolling OOS windows show whether an edge survives regime change. |
| Trade-4 supports the workflow | Its fingerprinted runs, multi-strategy testing, and re-entry analytics make honest, reproducible significance checks practical for small-cap traders. |
Table of Contents
- What Does Statistical Significance in Backtesting Mean?
- How Much Data Do You Need for Statistical Power?
- Why Testing Many Strategies Inflates False Positives
- Which Resampling Tests Confirm a Backtest Isn't Luck?
- Does Out-of-Sample Testing Prove a Strategy Persists?
- How Do You Document a Reproducible Significance Test?
- What Does Reproducible Backtesting Look Like in Practice?
- What Backtest Significance Actually Tells You
- Get a No-Code Way to Run These Checks on Your Own Data
- Sources for Going Deeper
What Does Statistical Significance in Backtesting Mean?
Statistical significance in backtesting answers one narrow question: could this result have happened by chance under a reasonable null hypothesis? It says nothing about whether the strategy is tradable after costs, whether the regime that produced the edge still exists, or whether you got lucky picking which of 200 variants to report.
The classical starting point is the t-statistic, calculated from the mean return divided by its standard error. For a strategy's Sharpe ratio, the t-stat roughly equals the Sharpe multiplied by the square root of the number of independent periods observed. A p-value then tells you how likely a t-stat that extreme is under the assumption of no real edge, and a confidence interval gives you a range instead of a single point estimate.
Three things go wrong constantly:
- Traders treat p < 0.05 as proof, when it's a weak, single-test threshold that says nothing about robustness.
- Daily returns are typically autocorrelated and fat-tailed, which violates the normal-theory assumptions behind the classic t-test and can make significance look better than it is.
- Confidence intervals get ignored entirely, even though a Sharpe of 1.2 with a confidence interval spanning 0.1 to 2.3 is a very different claim than the same Sharpe with a tight band.
None of this is a reason to abandon these metrics. It's a reason to treat them as a first gate, not a verdict.
How Much Data Do You Need for Statistical Power?
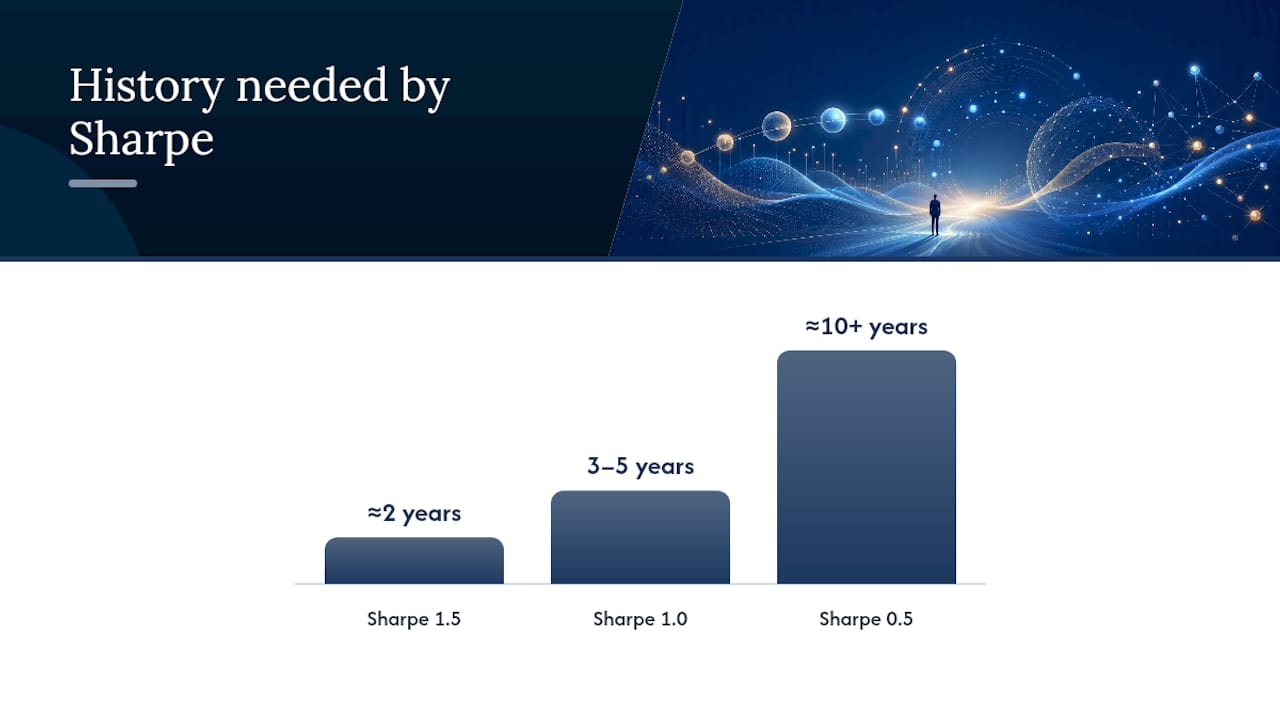
Statistical power is the probability your test detects a real edge if one exists. It depends on sample size, the size of the effect you're hunting for, and the noise in the return series. Low-Sharpe strategies need dramatically more history than high-Sharpe ones to clear the same bar, and most researchers underestimate this by an order of magnitude.
Rough inversions, assuming daily returns and independence (a generous assumption):
- Detecting a Sharpe of 1.5 with reasonable confidence typically needs a couple of years of daily data.
- Detecting a Sharpe of 1.0 pushes that toward three to five years.
- Detecting a Sharpe of 0.5, which describes a lot of real, tradable strategies, can require a decade or more of daily observations.
Autocorrelation makes this worse. If your signal only fires a few times a week, or your returns cluster because of overlapping holding periods, your effective sample size is smaller than your raw trade count suggests. A strategy with 500 trades that are 60% correlated with the prior day behaves statistically like a strategy with far fewer independent observations.
When you're underpowered, you have three honest options: pool similar instruments to expand the sample, extend your lookback where the market regime is still comparable, or lean harder on resampling methods that don't require the normal-distribution assumptions the t-test needs.
Pro Tip: If your backtest has fewer than a moderate number of independent trades, treat any Sharpe estimate as a hypothesis, not a finding.
Why Testing Many Strategies Inflates False Positives
Run one strategy variant and a t-stat of 2 means something. Run 200 variants and pick the best one, and a t-stat of 2 on that winner is nearly guaranteed by chance alone. This is the family-wise error rate problem, and it's the single biggest reason backtested edges evaporate live.
The math is unforgiving: with enough independent trials, the expected maximum Sharpe you'd see from pure noise climbs steadily, sometimes rivaling what researchers report as their "discovered" edge. Bonferroni correction (dividing your significance threshold by the number of tests) fixes the false-positive problem but is often too conservative for iterative research, where you're not really running independent tests so much as exploring a correlated parameter space.
Two more targeted tools do better:
- The Deflated Sharpe Ratio (DSR) adjusts the observed Sharpe for the number of trials, the length of the track record, and non-normality in returns (skewness and kurtosis). A negative DSR means your Sharpe is at or below the noise floor once you account for how many shots you took.
- Probability of Backtest Overfitting (PBO), estimated through the Combinatorially Symmetric Cross-Validation (CSCV) procedure, estimates how likely it is that your best in-sample configuration underperforms out-of-sample relative to the pack you tested.
Pro Tip: Keep a running log of every parameter combination you test, including the ones that failed. That log is what makes a DSR or PBO calculation honest instead of decorative.
Which Resampling Tests Confirm a Backtest Isn't Luck?
Resampling methods build a distribution-free null instead of assuming your returns follow a normal curve. They answer the question classical tests can't: how often would a strategy this good show up from random noise given the same market data?
- Permutation tests (Monte Carlo permutation tests, or MCPT) shuffle your entry signals, or the price series itself, and rerun the strategy hundreds or thousands of times to build a null distribution of Sharpe ratios or returns. Where your actual result lands in that distribution gives you a direct, empirical p-value.
- Block bootstrap resamples contiguous chunks of returns rather than individual days, preserving the autocorrelation and volatility clustering that a naive shuffle destroys. Skipping the block structure understates how hard a real null should be to beat.
- The "monkey test" compares your strategy against randomized entries under identical exit and risk rules, a blunt but effective sanity check that catches strategies whose edge is really just market drift or volatility exposure.
A strategy that survives permutation testing at a genuinely low empirical p-value, and still holds up after DSR deflation, is in a different category of evidence than one that only clears a textbook t-test.
Does Out-of-Sample Testing Prove a Strategy Persists?
Out-of-sample and walk-forward testing answer the question resampling can't: does the edge hold up on data the strategy never touched during design? Walk-forward validation splits history into rolling windows, fitting on one segment and testing on the next, then rolling forward. A pre-OOS purge dropping a buffer period between train and test windows prevents leakage from overlapping trade horizons.
Numeric gates practitioners commonly apply:
- Rank stability: your strategy's relative ranking among tested variants shouldn't swing wildly across walk-forward folds.
- An overfit ratio comparing in-sample to out-of-sample performance degradation, where a steep drop is a red flag regardless of how good the in-sample number looked.
- Top-K persistence, checking whether the same handful of configurations keep outperforming across different OOS windows rather than a new "winner" every time.
Walk-forward results mean the most when read alongside DSR and permutation testing, not instead of them. Convergence across all three is the strongest signal you'll get.
How Do You Document a Reproducible Significance Test?
A significance claim you can't reproduce isn't a claim, it's an anecdote. Building an audit trail takes discipline but not much extra time if you build it into your workflow from the start.
- Log every trial: the full parameter grid, every configuration tested (not just the winners), and the exact date ranges used.
- Fix a random seed for every resampling or permutation run, and generate a fingerprint (a SHA-256 hash of the configuration) so any run can be verified as identical later.
- Apply DSR or PBO whenever you've tested more than a handful of variants, and never skip the permutation/bootstrap null just because the in-sample Sharpe looks good.
- Run a walk-forward test with realistic transaction costs and slippage baked in, not added after the fact.
- Archive the raw resampling outputs, the DSR calculation, and a short written note explaining what you tested and why, so a colleague, or you in six months, can retrace the logic.
Pro Tip: Write the interpretive note before you get attached to the result. It's much easier to be honest about a strategy's weaknesses before you've started mentally spending the profits.
What Does Reproducible Backtesting Look Like in Practice?
The checklist above is straightforward to write and genuinely hard to execute by hand, spreadsheet tracking of trial counts, manually re-running seeded permutations, hunting for the config that produced last week's promising number. This is where the tooling you use for backtesting either helps or quietly undermines your own significance claims.

Trade-4 was built around the same discipline the checklist demands. Every run carries a configuration fingerprint, so when you rerun a permutation or bootstrap test, you know it's using the same setup, not a slightly drifted version of it. Multi-strategy runs let you test parameter grids honestly, with every variant recorded rather than only the ones you liked. Same-day re-entry analytics and news tagging let you segment performance by condition instead of averaging away the regime-dependence that walk-forward testing is designed to catch. Exportable reports mean your DSR or PBO inputs, and the raw resampling outputs behind them, are archived in a form someone else could check.
None of this replaces doing the math. It replaces the friction that usually stops traders from doing the math at all.
What Backtest Significance Actually Tells You
The uncomfortable truth about statistical significance in backtesting is that most traders want it to answer a question it was never built to answer: "will this make money?" It can't. It can only tell you whether your historical result is distinguishable from noise, and even that answer depends entirely on how honestly you accounted for how you got there.
The conventional wisdom treats DSR, PBO, and permutation testing as advanced add-ons for people building institutional-grade systems. That framing is backwards. A retail trader running a laptop-scale research loop is more exposed to selection bias than a well-staffed quant desk, not less, because there's no compliance function forcing a written trial log and no second researcher asking "how many other versions did you try before this one?" The tools exist precisely because informal research processes are where overfitting hides best.
The other underappreciated point: walk-forward persistence and statistical significance are answering different questions, and treating them as substitutes is how good backtests die in live trading. A strategy can pass a permutation test on 2019 to 2024 data and still fail walk-forward because the regime that generated the signal ended in 2023. Significance tells you the historical pattern wasn't noise. Walk-forward tells you whether that pattern is still operative. You need both, and neither is optional just because the other looks good.
— Romans
Get a No-Code Way to Run These Checks on Your Own Data
Running permutation tests, DSR calculations, and walk-forward folds by hand is where most independent researchers quietly give up on rigor, not because they don't understand the math, but because rebuilding the plumbing for every variant is exhausting. Trade-4 gives small-cap traders a no-code way to run the checklist itself: visual pattern builders for defining variants, tick-level historical data down to one second for realistic fills, and multi-strategy runs that keep every trial on record instead of just the winner.

If you're testing gap or runner setups on small caps, the platform's same-day re-entry analytics and news tagging let you segment results by the exact conditions a walk-forward test needs to isolate. Read the step-by-step backtesting guide for a walkthrough, or go straight to the Trade-4 Backtester to see the feature set. Start a trial through Getting Started and run your next strategy through the same rigor this article just laid out.
Sources for Going Deeper
- The probability of backtest overfitting (CSCV framework paper)
- Statistical validation research guide covering DSR, PSR, and Romano–Wolf methods
- Practitioner guide to permutation tests and Monte Carlo nulls in backtesting
- Rule significance testing documentation on detrended signal tests