
A pyramiding backtest only earns your trust when it models four things: dynamic per-layer fills and slippage, live updates to your average entry price, aggregated stop management across the entire position, and Max Capital Utilization tracking. Pyramiding tends to lift net profit in trending markets, but it also raises drawdown and capital exposure unless you model fills conservatively. Track Max Capital Utilization and Pyramiding Success Ratio from the first run, and treat any platform, including Trade-4, as a tool that's only as reliable as the fill logic you configure inside it.
TL;DR:
- To accurately backtest pyramiding strategies, your system must model per-layer fills, slippage, timestamps, and aggregate stop recalculations in real time.
- Metrics like Max Capital Utilization and Pyramiding Success Ratio provide a clearer picture of capital risk and performance than net profit alone.
- Use volume caps, size scaling, and volatility-adjusted slippage assumptions to avoid inflating results with unrealistic fill assumptions.
- Conduct walk-forward, Monte Carlo, and parameter sweep tests to verify that pyramiding rules are robust and not overfit to specific data periods.
- Before live trading, ensure your backtest shows stable out-of-sample performance, realistic fill behavior, and controlled capital utilization.
Table of Contents
- What Changes When You Backtest a Pyramiding Strategy
- What Metrics Actually Expose Pyramiding Risk
- How Do You Model Realistic Fills for Pyramiding?
- Which Spacing and Sizing Rules Should You Test First?
- How Do You Validate That a Pyramiding Rule Isn't Overfit?
- What Should You Check Before Trusting Your First Run?
- What Does a Realistic Backtest Comparison Actually Show?
- When Does Pyramiding Actually Earn Its Place in a Strategy?
- Should You Trade a Pyramiding System Live? A Go/No-Go Checklist
- How Trade-4 Maps to These Non-Negotiables
What Changes When You Backtest a Pyramiding Strategy
A single-entry backtest is simple: one fill, one stop, one exit. Pyramiding trading backtest architecture is different. Every add is a discrete event that changes your average entry price, your aggregated position size, and your capital at risk simultaneously. Your backtester has to treat each layer as its own fill with its own timestamp and price, then roll those fills into a running position state.
That means three engineering requirements come before you write a single entry rule.
- Each add-on must update average entry and total size independently, not as a static recalculation at the end of the trade.
- Per-layer timestamps and capital consumed need tracking so you can enforce position and portfolio limits in real time, not after the fact.
- Your engine needs to support limit, market, and bracket orders, plus same-day re-entry logic, since pyramiding strategy analysis often depends on adding back into a name that stopped out and reversed.
Code-first frameworks like Backtrader expose sizers and volume-based fill logic that handle this natively. No-code platforms need equivalent controls exposed through configuration rather than scripting, which is where a visual pattern builder earns its keep, letting you define add conditions, layer caps, and stop behavior without writing execution logic from scratch.
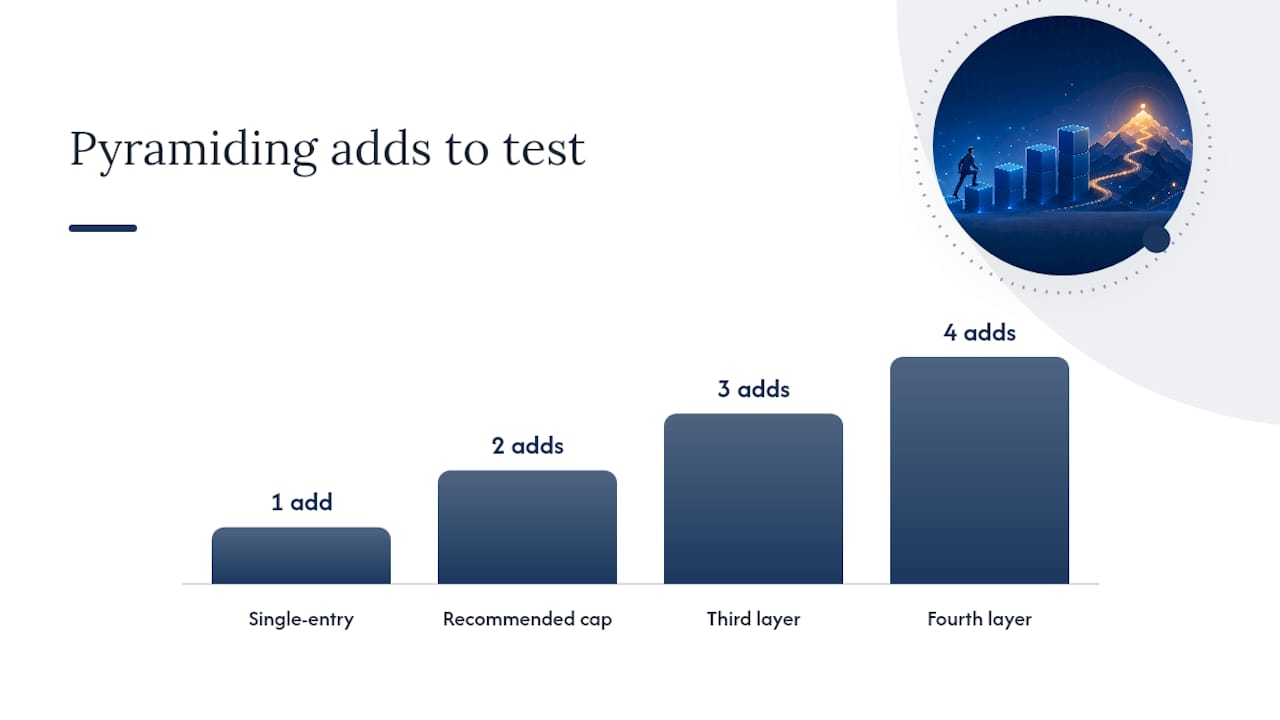
Pro Tip: Run your first pyramiding backtest with a hard cap of two adds. If the strategy can't show an edge with two layers, adding a third or fourth almost never fixes it. It usually just compounds the same flaw.
What Metrics Actually Expose Pyramiding Risk
Net profit alone hides how much capital a pyramiding strategy actually consumes to generate that profit. You need metrics built for scaled-in positions, not single-entry trades.
Max Capital Utilization (MCU) measures the peak percentage of available capital tied up across all open layers at any single point in the backtest. It's fragile.
Pyramiding Success Ratio (PSR) tracks the percentage of pyramided trades that outperform what a single-entry version of the same trade would have returned. Average Layer Depth (ALD) tells you how many adds the strategy typically executes per trade, which flags whether your system is disciplined or chasing.
Metric Snapshot: Backtesting comparisons of single-entry versus pyramiding setups consistently show higher net profit for pyramiding, paired with larger maximum drawdown and Sharpe ratios that swing depending on market regime and configuration.
Trade-level Sharpe, Maximum Adverse Excursion (MAE), and layer-specific slippage accounting round out the picture. When comparing single-entry against pyramiding trading backtest results, prioritize MCU and PSR over raw profit. They tell you whether the edge survives contact with real capital constraints.
How Do You Model Realistic Fills for Pyramiding?
Backtests inflate pyramiding results most often through unrealistic fill assumptions. A strategy that adds three layers into a thin small-cap name at the exact quoted price rarely reflects what would happen live.
- Cap fills by historical volume. Apply a per-layer limit based on a percentage of average daily volume (ADV), and reject or penalize adds that would exceed practical liquidity at that price level.
- Scale slippage with size and volatility. A fixed slippage assumption across every layer is a common curve-fitting trap. Slippage should grow with layer size and with the volatility regime at the time of the add.
- Model order aging and partial fills. Limit orders don't fill instantly. Simulate execution delay and run a worst-case partial-fill scenario alongside your baseline to see how sensitive results are to fill quality.
- Account for margin and buying power. Leveraged instruments need margin mechanics built in, since a fourth add might be mathematically valid but practically impossible once buying power runs out.
Pro Tip: Run every pyramiding backtest twice, once with optimistic fills and once with worst-case partial fills and doubled slippage. If your edge disappears in the second run, you're looking at a curve-fit result, not a tradable one.
Which Spacing and Sizing Rules Should You Test First?
Layer spacing and sizing decisions drive most of the variance in pyramiding trading backtest outcomes, and they're where overfitting creeps in fastest.
- Fixed tick or percentage spacing is simple and easy to audit, but it ignores volatility, so it tends to over-add in choppy conditions.
- ATR-based spacing adjusts add distance to current volatility, which generally produces more robust results across different market regimes than fixed spacing.
- Indicator-confirmation spacing (waiting for a momentum or trend signal before adding) reduces the frequency of adds but demands more historical data to validate reliably.
On sizing, a decreasing or inverse sequence, where each add is smaller than the last, keeps capital utilization from spiraling and tends to outperform fixed-size adds in drawdown terms. Tighten your aggregated stop after every add rather than leaving the original stop in place; the position's risk profile changes with each layer, and your stop management needs to change with it.
How Do You Validate That a Pyramiding Rule Isn't Overfit?
A pyramiding rule that only works on the exact date range you tested it on isn't a strategy. It's a coincidence with extra steps.
- Run walk-forward analysis. Split your data into sequential in-sample and out-of-sample windows, refitting parameters only on the in-sample portion. Pyramiding rules are dynamic by nature, so walk-forward testing matters more here than for simpler entry logic.
- Stress-test with Monte Carlo or block-bootstrap sampling. Resample your trade sequence to see how sensitive the equity curve is to trade order and clustering. A strategy that only looks good in one specific sequence is fragile.
- Sweep parameters across sensible ranges, not narrow ones. Vectorized backtesting engines can run thousands of configurations quickly, which makes it practical to test wide spacing and sizing ranges instead of a handful of hand-picked values.
- Report worst-case MCU and slippage from the stress tests, not just the average-case numbers from your best run.
What Should You Check Before Trusting Your First Run?
Before you trust any output, confirm the backtest actually enabled the features that make pyramiding realistic.
- Per-layer fills and per-layer slippage are both active, not a single blended average.
- Volume caps are enforced per add, not just at the trade level.
- Aggregated stops recalculate after each add, and MCU reporting runs alongside standard metrics.
- Walk-forward and Monte Carlo modules are available and configured with reasonable ranges.
Data needs scale with timeframe: intraday pyramiding generally calls for 1 to 5 minute or tick-level data, while swing-style pyramiding can run on daily bars.
A simple logic check to build into your engine: on add, update average entry, move the aggregated stop, recalculate MCU. If that sequence doesn't fire on every layer, the backtest is lying to you.
Pro Tip: After your first run, check for suspiciously high fill rates, near-zero slippage, or negative MCU readings. All three usually mean a modeling bug, not a good strategy. For a full walkthrough of configuration steps, Trade-4's step-by-step backtesting guide covers the setup process in more detail.
What Does a Realistic Backtest Comparison Actually Show?
Backtest comparisons of single-entry versus pyramiding setups on the same underlying strategy typically show a consistent pattern once execution realism gets applied.
- Net profit: pyramiding usually comes out higher, sometimes substantially, in trending market conditions.
- Maximum drawdown: pyramiding's drawdown runs larger, and the gap widens further once slippage and volume caps get applied.
- Sharpe ratio: results vary by regime, meaning pyramiding doesn't reliably improve risk-adjusted returns across every market condition.
Statistic Callout: Comparative backtests of pyramiding versus single-entry strategies show that once slippage and Max Capital Utilization constraints are applied conservatively, the profit advantage narrows meaningfully compared to idealized, fill-optimistic runs.
The takeaway isn't that pyramiding fails. It's that the gap between an idealized and a realistic backtest is where most traders get misled. You can reproduce this comparison directly by running the same rule set through single-entry and pyramided configurations in your own backtester and comparing MCU alongside net profit.
When Does Pyramiding Actually Earn Its Place in a Strategy?
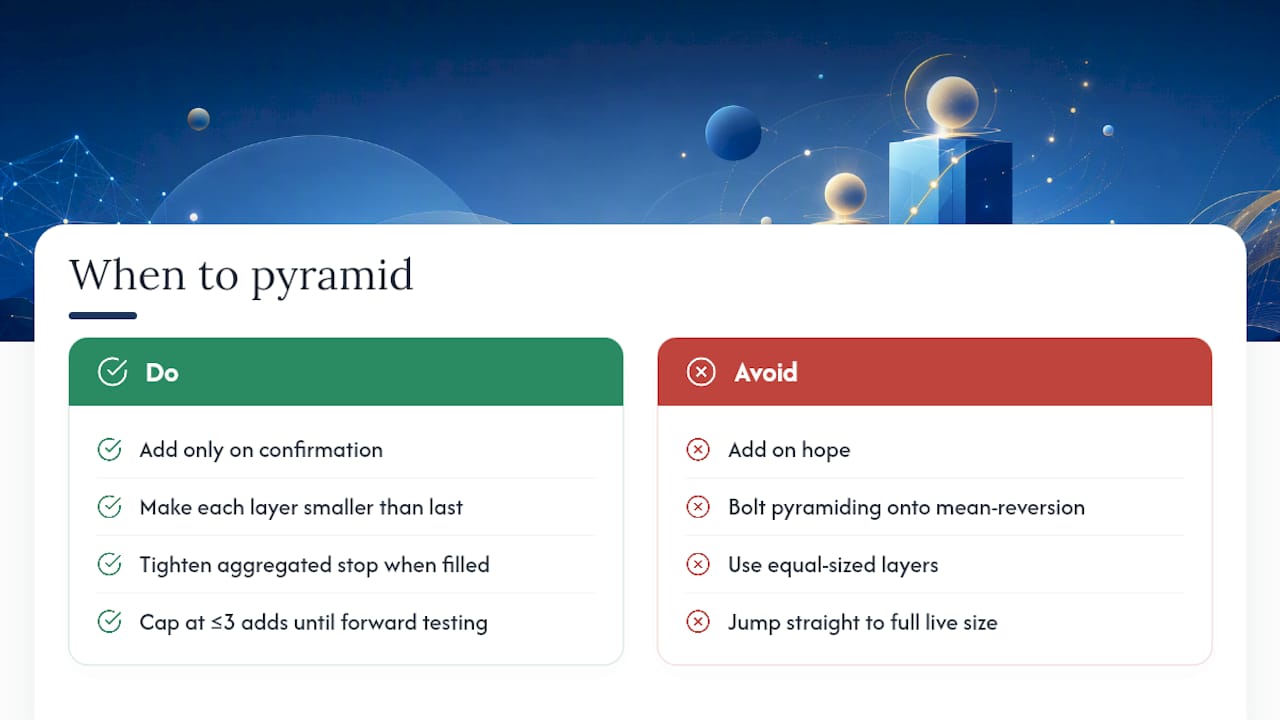
Pyramiding works best as an addition to trend-following systems, less so bolted onto mean-reversion setups where each add fights the eventual reversal. My rule of thumb: only add on confirmation, never on hope. Make each layer smaller than the last, and tighten your aggregated stop the moment a new layer fills.
Cap yourself at three adds until months of forward testing prove the fourth is worth the capital. Move from backtest to small live size gradually. For the mechanics of setting this up, Trade-4's backtesting walkthrough covers the configuration steps in detail.
— Romans
Should You Trade a Pyramiding System Live? A Go/No-Go Checklist
Five things are non-negotiable before you trust a pyramiding backtest: realistic per-layer fills, volatility-scaled slippage, MCU tracking, aggregated stops that tighten after each add, and robustness testing through walk-forward or Monte Carlo methods. Skip any one, and the backtest is telling you a story rather than a fact.
Run this three-step check before risking real capital:
- Fills and slippage: does performance hold up under worst-case partial fills and doubled slippage?
- Capital utilization: does MCU stay within a cap you're comfortable holding in a real account?
- Out-of-sample stability: does walk-forward or Monte Carlo testing show performance holding up outside the original sample?
| Checklist Item | Pass Condition |
|---|---|
| Conservative fills/slippage | Edge survives worst-case scenario |
| Max Capital Utilization | Stays within your defined cap |
| Walk-forward / Monte Carlo | Stable out-of-sample performance |
Pass all three, then scale into live trading with limited capital before committing full size.
How Trade-4 Maps to These Non-Negotiables
A visual pattern builder lets you define add-on rules, layer caps, and aggregated stop logic without writing execution code, which covers the architecture piece this article opened with. Historical data with fine granularity supports the fill and slippage realism intraday pyramiding demands, and re-entry analytics handle the re-entry logic that trips up simpler backtesters.

Bucketed performance analysis and cost modeling give you the reporting layer needed to track capital utilization and layer-level outcomes across a full test run, rather than just a single blended result. If you want to see how these pieces fit together on an actual configuration, Trade-4's getting-started guide walks through setting up your first test, and the Trade-4 backtesting platform is where you'd run it.
This article is general information, not a substitute for advice from a qualified financial advisor. Consult a qualified financial professional about your own circumstances before acting on anything here.