
Yes, you can run a reliable news catalyst backtest, but only if you preserve exact event timestamps, align them to tick or bar data, filter by impact, and model realistic slippage. Skip any one of those steps and your win rate is fiction. Before you trust a single number, confirm your event feed has UTC timestamps, your price data matches in granularity, and your entry rules were fixed before you saw the results.
TL;DR:
- Accurate backtests require preserving event timestamps in UTC, aligning them properly with price data, and modeling realistic slippage to avoid inflated win rates.
- Deduplication of news events and explicit join rules are essential to prevent overcounting and misattributing market reactions to the wrong news.
- Reaction windows should vary based on event types, with macro releases often best analyzed at the 15-minute mark to filter out market noise.
- Validating results with out-of-sample testing and sensitivity analysis is crucial to avoid overfitting and ensure strategy robustness.
- Backtesting platforms must support native news tagging, precise timestamp handling, and detailed performance metrics to reliably evaluate catalyst strategies.
Table of Contents
- Checklist: Data Fields, Price Granularity, and Tooling You Need
- Assembling and Aligning Datasets: Timestamps, Dedupe, and Join Rules
- Design Signal Rules and Confirmation Logic
- Choosing Reaction Windows: Immediate, Short, Session, and Multi-Day Horizons
- Pitfalls and Mitigations: Lookahead Bias, Duplicates, Fills, and Overfitting
- Metrics and Reporting: The Scorecard That Tells You If It's Tradable
- A Repeatable Workflow You Can Copy Into Your Research Notebook
- How Trade-4 Supports This Exact Checklist
- Romans' Practical Takeaways From Building Catalyst Backtests for Small Caps
- Try Trade-4: Run These Templates and Start Testing
Checklist: Data Fields, Price Granularity, and Tooling You Need
Before you build anything, audit what you actually have. Most failed catalyst backtests trace back to a gap in one of three areas: the event feed, the price data, or the tooling that joins them.
Your event feed needs these minimum fields to be usable for market news backtesting:
- Unique event ID and UTC timestamp (not a local time you have to guess about)
- Forecast, actual, and previous values, plus an impact tag (high/medium/low)
- Symbol tags linking the event to the instruments it affects
- Source attribution, so you can trace and deduplicate later
On the price side, you want tick data or 1 second to 1 minute bars, depending on how tight your reaction window is. Decide upfront whether you're working with continuous data or sessionized data, and whether your feed is exchange-direct or consolidated, since consolidated feeds can lag exchange prints by a meaningful margin during volatile opens.
Your backtester needs to support news tagging natively, not as an afterthought bolted onto a generic price simulator. Look for versioned experiment storage too. If you can't reproduce last month's test exactly, you can't trust this month's either.
Assembling and Aligning Datasets: Timestamps, Dedupe, and Join Rules
The join between your event feed and your price series is where most backtests quietly go wrong. Get this part right and everything downstream gets easier.
- Preserve the original vendor timestamp. Normalize it to UTC, but keep the source timestamp in a separate field. If you're simulating retail-grade data delivery, add a realistic latency buffer rather than assuming instant receipt.
- Deduplicate identical headlines. Multiple wire services often republish the same story within seconds of each other. Use the earliest valid timestamp per event ID and collapse the rest, or you'll count one event three times and inflate your sample size.
- Define the join strategy explicitly. Ignore any ticks before the configured catalyst timestamp, set a canonical confirmation window, and document exactly how you handle rounding at the boundary. QuantGist's event-driven framework treats this timestamp discipline as the foundation of the entire test, and for good reason: a single misaligned timestamp can shift your entire reaction window into a period of unrelated price noise.
- Handle daylight saving time explicitly. A backtest that silently shifts by an hour twice a year will misattribute reactions to the wrong side of a release.
Design Signal Rules and Confirmation Logic
Vague entry logic is the fastest way to fool yourself. Write the rule down as a formula before you touch the data, not after you've already seen what "works."
A workable template looks like this:
- Enter only if
surprise_score > Xand the asset movesYticks withinZminutes of the timestamp - Size the position as a fixed percentage of notional, decided in advance
- Exit after
Nminutes or on a defined reversal threshold, whichever comes first
This mirrors the catalyst-confirmation approach used in open-source trading skill libraries, where a trade only triggers after a configured confirmation move follows the catalyst timestamp within a set number of ticks. That confirmation step filters out headlines that generate noise but no real follow-through, though it only works if your fills are tick-accurate; a confirmation window measured in 1-minute bars will miss the exact moment the move actually happened.
Decide early whether surprise or sentiment is an entry filter or a confirmation signal after entry. Those are different jobs, and conflating them is how traders end up curve-fitting a rule to one lucky quarter.
Pro Tip: Fix your sizing and exit rules before you run the first test. If you're still adjusting them after looking at the equity curve, you're not backtesting anymore, you're reverse-engineering a story.
Choosing Reaction Windows: Immediate, Short, Session, and Multi-Day Horizons
Different event types move markets on different clocks, and testing only one horizon will hide most of the truth.
- CPI and NFP releases: sharp impulses, often cleanest at the 1 to 15 minute mark, with a secondary check at the 1-day close
- FOMC decisions: phased, multi-hour reactions as markets digest the statement, then the press conference, then follow-through commentary
- Earnings: intraday reaction through roughly three days, since guidance and analyst notes keep moving the price after the initial print
The 1 to 5 minute window is often dominated by microstructure noise, bid-ask bounce, and algorithmic front-running rather than the actual information content of the release. QuantGist's framework recommends the 15-minute mark as a cleaner read for many macro releases, since it lets the initial noise settle while still capturing the primary reaction. Always report results across every horizon you test, not just the one that happened to look best.
Pitfalls and Mitigations: Lookahead Bias, Duplicates, Fills, and Overfitting
Four failure modes account for most inflated catalyst backtest results, and each has a specific fix.
- Lookahead bias. Economic data gets revised. If your backtest joins the revised figure to a timestamp from before the revision existed, you're trading on information you couldn't have had. Lock in the figure as it stood at the actual timestamp.
- Duplicate events. Merge overlapping feeds and count unique events only. QuantGist flags duplicate news counting as one of the most common ways a backtest looks better than the live strategy ever performs.
- Unrealistic fills. Spreads widen sharply at release. Model slippage explicitly, run sensitivity sweeps across a range of slippage assumptions, and report how much your edge survives the worst-case scenario. Platforms like cTrader often can't represent this kind of news-driven spread widening unless paired with dedicated news-management tooling, which is worth checking before you commit to a testing environment.
- Overfitting to a small sample. One open-source macro catalyst classifier was tested across many ISM PMI releases from 2019 to 2024, and its apparent predictive edge did not hold up as statistically significant once evaluated properly. That's the risk of trading a rule tuned on a handful of lucky prints.
Use walk-forward or out-of-sample validation before you trust any of it. A single strong quarter is not an edge.
Metrics and Reporting: The Scorecard That Tells You If It's Tradable
Win rate alone tells you almost nothing about whether a catalyst strategy survives contact with live markets. Build a scorecard instead.
- Hit rate, average return per event, and median return (the gap between average and median often exposes a strategy propped up by one outlier trade)
- MFE and MAE (maximum favorable and adverse excursion) to see how much room the trade needed before it worked
- Drawdown, expectancy, and sensitivity to slippage and latency assumptions
Break every one of those numbers down by event bucket: impact level, surprise quantile, and asset class, then again by reaction horizon. A strategy that looks strong in aggregate can be entirely carried by high-impact events on liquid large caps, and fall apart everywhere else. Where the sample allows, include a confidence interval or a basic significance check, and set a minimum sample size before you draw conclusions. Twenty events is a hypothesis, not a strategy. Sensitivity sweeps around position sizing, similar to Monte Carlo stress testing used elsewhere in trading journal analytics, can show how fragile your expectancy is before you ever risk live capital.
A Repeatable Workflow You Can Copy Into Your Research Notebook
- Choose your event family (CPI, earnings, breaking headlines) and your symbol universe.
- Pull the canonical event feed with full timestamp fidelity.
- Deduplicate and tag events by impact and source.
- Pull matching tick or bar data for the same window.
- Align timestamps and apply your join rules.
- Define fixed entry, sizing, and exit rules.
- Simulate with slippage and spread assumptions built in.
- Evaluate results per horizon, not just in aggregate.
- Validate out-of-sample or walk-forward before trusting any of it.
Version every dataset, every parameter set, and every result. If you can't reproduce a run six months from now, you don't have a backtest. You have a screenshot. Trade-4's step-by-step backtesting guide walks through this exact sequence inside a no-code environment.
How Trade-4 Supports This Exact Checklist
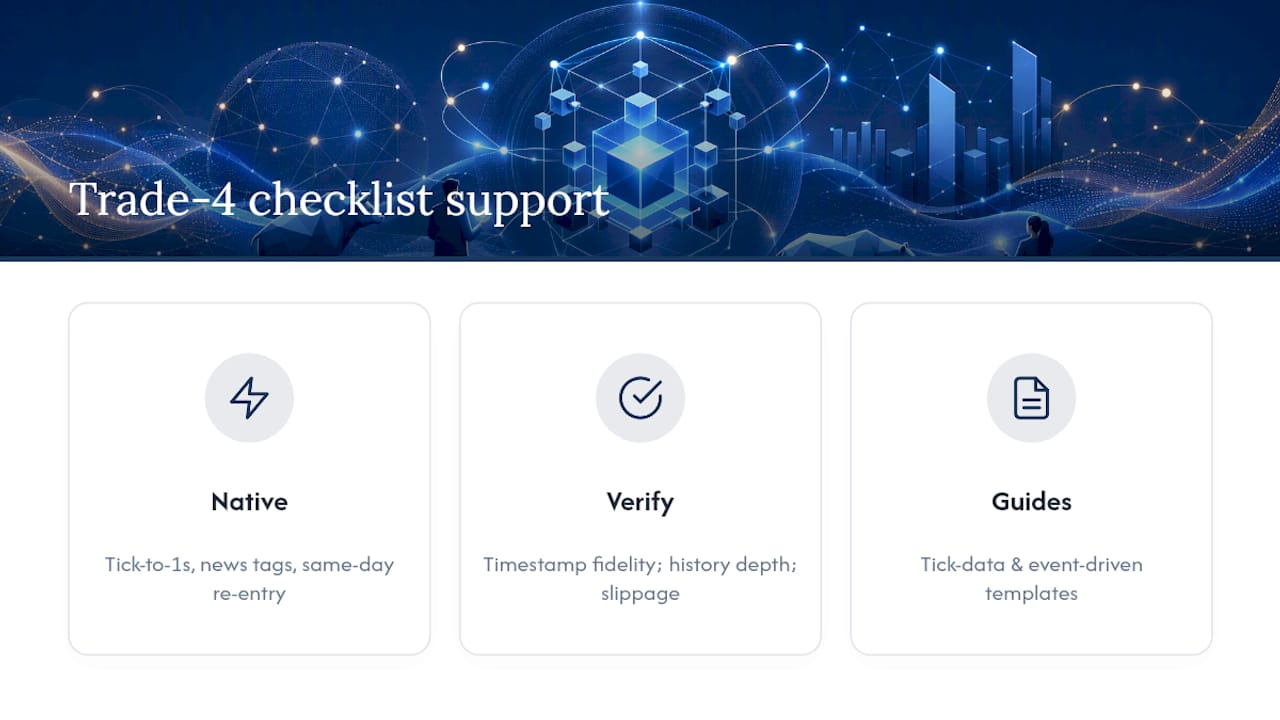
Some platforms cover most of this list natively: tick-to-1-second data, built-in news tagging, and same-day re-entry analytics for small-cap volatility. Whatever platform you choose, verify timestamp fidelity, data history depth, and slippage modeling yourself. Trade-4's tick data backtesting guide and event-driven backtesting guide show the templates in practice.
Romans' Practical Takeaways From Building Catalyst Backtests for Small Caps
The signal logic rarely kills a catalyst strategy. Liquidity and same-day re-entry constraints do, especially in small caps where a real fill looks nothing like a backtested one. Stop pursuing a candidate the moment your sample size can't support the confidence interval you're claiming, not after you've already built a trading plan around it.
— Romans
Try Trade-4: Run These Templates and Start Testing
You've seen the checklist. Trade-4 is where you actually run it, without writing a line of code. The platform gives you tick-to-1-second price history, native news tagging, and same-day re-entry analytics built specifically for small-cap volatility, the exact conditions where generic backtesters fall apart.

A starter trial can include tick-resolution testing and access to news-tagged strategy templates, allowing users to rebuild the confirmation-rule structure from this article on their own symbol universe within their first session. Head to the Trade-4 Backtester to see the visual pattern builder in action, or start with the getting-started guide for starter templates and a walkthrough of trial limits. Either way, you'll be running your first news catalyst backtest today, not next week.