
A credible stop-loss backtest simulates realistic fills, accounts for intrabar trigger behavior, resolves OCO conflicts consistently, models trading costs, and survives out-of-sample robustness checks before you trust the result. If your test skips any of those five, you're not measuring an edge. You're measuring noise dressed up as a Sharpe ratio.
TL;DR:
- Robust stop-loss backtesting must simulate realistic fills, account for intrabar behavior, and include trading costs, otherwise the results are just noise.
- Testing multiple stop types, such as fixed, percentage, ATR, trailing, and time-based exits, helps identify which best suits a given strategy’s entry logic and market regime.
- Accurately modeling fills requires assumptions about order execution and intrabar price paths, with synthetic interpolation offering the most precise results when tick data is unavailable.
- Data quality issues like gaps, splits, survivorship bias, and cost assumptions such as slippage and spreads critically influence stop-loss performance metrics.
- Applying out-of-sample robustness tests, including walk-forward and Monte Carlo resampling, is essential to distinguish genuine edges from overfitted or luck-driven results.
Table of Contents
- Stop-Loss Types and When to Test Each
- How Backtesters Simulate Stop Orders and Handle Fills
- Why Data Quality and Cost Assumptions Change Stop-Loss Results
- Evaluation Metrics and Robustness Tests You Must Run
- A Practical Workflow to Test Stop-Loss Variants Reproducibly
- Pitfalls, Biases, and Interpretation Traps in Stop-Loss Testing
- How Trade4 Supports Rigorous Stop-Loss Backtesting
- Stop-Loss Backtesting Examples Across Stocks, Forex, and Futures
- Integrating Stop-Loss Rules With Position Sizing and Risk Management
- Systematic Methods for Optimizing Stop-Loss Parameters
- The Practitioner's View on Stop-Loss Testing
- Test Your Stop-Loss Variants on Trade-4 Before You Risk Real Capital
- Sources
- FAQ
Stop-Loss Types and When to Test Each
Stop-loss backtesting starts with picking the right stop type for the strategy you're running, and each type behaves differently once you feed it into historical data. You'll want to test several variants side by side rather than committing to one on instinct.
- Fixed stop: A static dollar or point distance from entry (e.g., $0.50 below entry). Simple to code, but it ignores volatility, so it can be too tight in fast-moving names and too loose in quiet ones.
- Percentage stop: Exits when price moves a set percent against you Percentage stops, such as a few percent, are common starting points for equities.. Easy to compare across tickers with different price levels, but it still ignores each stock's own volatility profile.
- ATR-based stop: Places the stop at a multiple of Average True Range from entry, typically 1.5x to 3x ATR. This adapts to volatility automatically, which is why most systematic traders default to it once they move past fixed stops.
- Trailing stop: Moves with price in your favor but never loosens, locking in gains as a trade runs. It shines in trending regimes and gets chopped up in choppy, mean-reverting ones.
- Time exit / triple-barrier: Closes the trade after a fixed holding period regardless of price, often paired with an upper and lower barrier (the "triple barrier" method: profit target, stop loss, and time limit, whichever hits first).
Trailing stops make sense when you expect a trade to run and want to protect unrealized profit without capping upside. Fixed and percentage stops work better for mean-reversion setups where you're defining risk at entry and don't expect (or want) the trade to trend indefinitely. Test all four against the same trade signals before deciding, because the "right" stop type is a function of the entry logic, not a universal answer.
How Backtesters Simulate Stop Orders and Handle Fills
Every backtesting engine makes assumptions about what happens inside a candle, and those assumptions can swing your results by a wide margin. This is where most home-built backtests quietly lie to their authors.
Start with order semantics. A market order fills at the next available price. A stop order becomes a market order once price touches the stop level. A stop-limit order becomes a limit order at that point, which means it can fail to fill during a fast gap. Most backtesting frameworks, including popular Python libraries like Backtrader and event-driven engines built on pandas and NumPy, map these order types onto OHLC bar data, but that mapping is an approximation. A daily or even a 5-minute bar hides the actual sequence of prices that occurred inside it.
That hidden sequence is the intrabar problem, and it has three common solutions:
- First-touch assumption: Assume the stop and any target level are checked in the order price most plausibly moved (e.g., if the open is closer to the low, check the low first). This is fast but introduces guesswork.
- Worst-case assumption: If both a stop and a profit target could have been hit inside the same bar, assume the stop triggered first. Backtesting.py, for example, defaults to exactly this pessimistic assumption, which prevents you from overstating performance.
- Synthetic interpolation: Use finer-granularity data (1-minute or 1-second bars) to reconstruct the actual intrabar path instead of guessing. This is the most accurate method and the one Trade-4 supports through sub-minute historical data.
The conservative default, absent tick data, is the worst-case assumption. It costs you a little optimism but saves you from shipping a strategy that looks great on paper and bleeds money live.
OCO (one-cancels-other) handling matters just as much. When a stop and a take-profit sit on the same trade, your backtester has to decide which one "wins" if both levels fall inside the same bar's range. Getting this wrong in either direction, always favoring the stop or always favoring the target, systematically biases your win rate and your expectancy.
Finally, your fill model needs four ingredients to be taken seriously: slippage (a few basis points to several cents depending on liquidity), partial fills on large orders relative to volume, tick size rounding, and a volume cap so you're not backtesting fills larger than the bar's actual traded volume.
Pro Tip: Before trusting any stop-loss backtest, run the same test with best-case and worst-case intrabar assumptions. If the results diverge wildly, your edge is partly an artifact of fill assumptions, not a genuine market inefficiency.
Why Data Quality and Cost Assumptions Change Stop-Loss Results
Bad data produces bad stop-loss conclusions faster than almost any other backtesting mistake, because stops trigger on exact price levels. A single bad tick or an unadjusted split can trigger a phantom stop-out that never would have happened in real trading.
Before running any stop-loss variant, clean your dataset with these checks:
- Missing bars: Gaps in intraday data can make a stop appear to skip past its level with no fill, understating slippage.
- Corporate action adjustments: Splits, dividends, and reverse splits must be applied consistently, or a 2-for-1 split will look like your stop got blown through by 50%.
- Survivorship bias: Testing only on tickers that still exist today excludes delisted small-caps, which skews results toward survivors and inflates apparent win rates.
- Ticker continuity: Symbol changes and reused tickers can silently splice unrelated price histories together.
Cost modeling deserves equal attention. Commission structures vary from flat-fee to per-share, and spread costs on thin small-cap names can dwarf the commission entirely. A reasonable slippage estimate scales with both volatility and your position size relative to average volume; a $200 order in a name trading 2 million shares a day behaves nothing like the same order in a name trading 50,000 shares.
Bar granularity should match the stop type you're testing. A tight ATR stop on a fast-moving small-cap tested on daily bars will miss most of the actual intrabar action that would have triggered it, so 1-minute or 1-second data (the kind Trade-4 provides) produces materially more trustworthy stop-loss conclusions than daily-bar approximations. Add a minimum average-volume filter to your universe, too. A backtest that assumes you can enter and exit a 10,000-share position in a stock trading 30,000 shares a day is testing a fantasy, not a strategy.
Evaluation Metrics and Robustness Tests You Must Run
A stop-loss variant isn't validated until it survives more than one type of scrutiny, and the single biggest reason backtested strategies fail live is that they were never tested this way in the first place. A widely cited study of many strategies found near-zero correlation between backtested Sharpe ratio and live trading performance, largely because those strategies were overfit to a single historical path rather than validated against multiple ones.
Start with core performance metrics, computed per stop-loss variant:
- Expectancy (R-multiple): Average profit or loss per trade, expressed as a multiple of initial risk.
- Profit factor: Gross profit divided by gross loss; above 1.5 is generally considered workable, though this depends heavily on trade frequency.
- Sharpe and Sortino ratios: Risk-adjusted return, with Sortino penalizing only downside volatility.
- Max drawdown and recovery time: How deep the equity curve fell and how long it took to recover.
- Win rate: Useful only alongside expectancy, since a 30% win rate with a 4R average winner beats a 70% win rate with a 0.5R average winner.
Once the metrics look reasonable, robustness testing separates a real edge from a lucky curve fit. Walk-forward optimization re-optimizes your stop parameters on a rolling window and tests each optimized set on the following unseen period, giving you an out-of-sample efficiency ratio: how much of your in-sample performance survived contact with new data. Monte Carlo trade-sequence resampling shuffles the order of your historical trades thousands of times to build a distribution of possible equity curves, revealing whether your result depends on a fortunate sequence rather than the stop logic itself. Stress-testing against known crisis windows (2020, 2022) shows how a given stop distance behaves when volatility spikes far outside your training data's normal range.
For traders running many parameter combinations, Combinatorial Purged Cross-Validation (CPCV) and the Deflated Sharpe Ratio (DSR) guard against multiple-testing bias, the statistical inflation that happens when you test 200 ATR multipliers and report only the best one. DSR adjusts your Sharpe ratio downward based on how many trials you ran to find it, which is often the difference between a strategy that looks brilliant and one that's simply the luckiest draw from a large batch.
A Practical Workflow to Test Stop-Loss Variants Reproducibly
Treat stop-loss selection as an experiment with defined stages, not a single backtest you eyeball once and deploy.
- Design: Limit yourself to two or three parameter dimensions (stop type, distance, maybe a time filter). Split your data 70/30 or by rolling walk-forward windows, and pick a search method, grid search for a handful of parameters, vectorized sweep for speed across hundreds of combinations.
- Execute: Run batched experiments across your parameter grid, recording per-run summary statistics and per-trade R-multiples rather than just an aggregate return. Save the equity curve for every run so you can visually inspect shape, not just the final number.
- Validate: Apply Monte Carlo resampling, walk-forward testing, and at least one stress scenario. Set GO/NO-GO thresholds before you look at results, for example, a minimum out-of-sample efficiency ratio and a maximum acceptable drawdown, so you're not rationalizing a threshold after seeing a number you like.
- Deploy and monitor: Define a re-evaluation cadence (monthly or quarterly) and explicit re-entry rules so you're not manually second-guessing every stop-out, which leads to the costly churn of repeatedly selling and buying back the same position.
Pro Tip: Write your GO/NO-GO thresholds down before running the validation step. Reading a Monte Carlo distribution after you already know the headline return almost always leads to unconscious goalpost-moving.
Vectorized frameworks like VectorBT speed up grid sweeps across hundreds of stop combinations, while event-driven engines model order execution more explicitly at the cost of speed. Choose based on whether you're screening broadly or confirming a finalist.
Pitfalls, Biases, and Interpretation Traps in Stop-Loss Testing
Most bad stop-loss conclusions trace back to a handful of repeat offenders, and they're worth checking for by name before you trust any result.
- Parameter multiplicity: Testing dozens of ATR multipliers and reporting only the best one inflates your in-sample Sharpe ratio without adding real skill. This is exactly what CPCV and DSR exist to catch.
- Lookahead bias: Using a bar's high or low to place a stop level that wouldn't have been known until the bar closed, or building re-entry rules that reference future price action, quietly hands your backtest information a live trader never has.
- Low trade counts: A stop variant that only triggered 40 times over your test window doesn't carry enough statistical weight to trust, regardless of how good those 40 outcomes look. A hundred trades is a reasonable floor for a preliminary read, but even that can mislead if it's concentrated in one market regime.
- Regime dependence: A trailing stop that looks excellent during a strong 2023 uptrend may simply be capturing trend-following performance, not doing anything special with the stop itself. Practitioners commonly find that stop-loss rules underperform buy-and-hold specifically during crashes, because they sell near the bottom and re-enter higher once the recovery is underway.
- Red flags to scan for: implausible profit factors above 3, equity curves with one or two outsized spikes driving the whole return, and results that collapse when you nudge a parameter by 10%.
How Trade4 Supports Rigorous Stop-Loss Backtesting
A no-code backtester can provide small-cap traders with granular tools that rigorous stop-loss testing demands, without writing a single line of Python. Historical data down to one-second bars lets you test intrabar stop behavior with far more precision than daily or even minute data allows, and built-in slippage and cost modeling means you're not bolting fill assumptions on after the fact.
Same-day re-entry analytics can show what happens after a stop-out, whether re-entering costs money through churn or captures a genuine second move. News tagging can help isolate whether a stop got triggered by a catalyst-driven spike rather than organic price action, and multi-strategy job queues enable running several stop variants in parallel instead of one at a time. For step-by-step walkthroughs, Romans's how-to backtest a trading strategy step by step guide covers the workflow described above using such a platform's interface.
Stop-Loss Backtesting Examples Across Stocks, Forex, and Futures
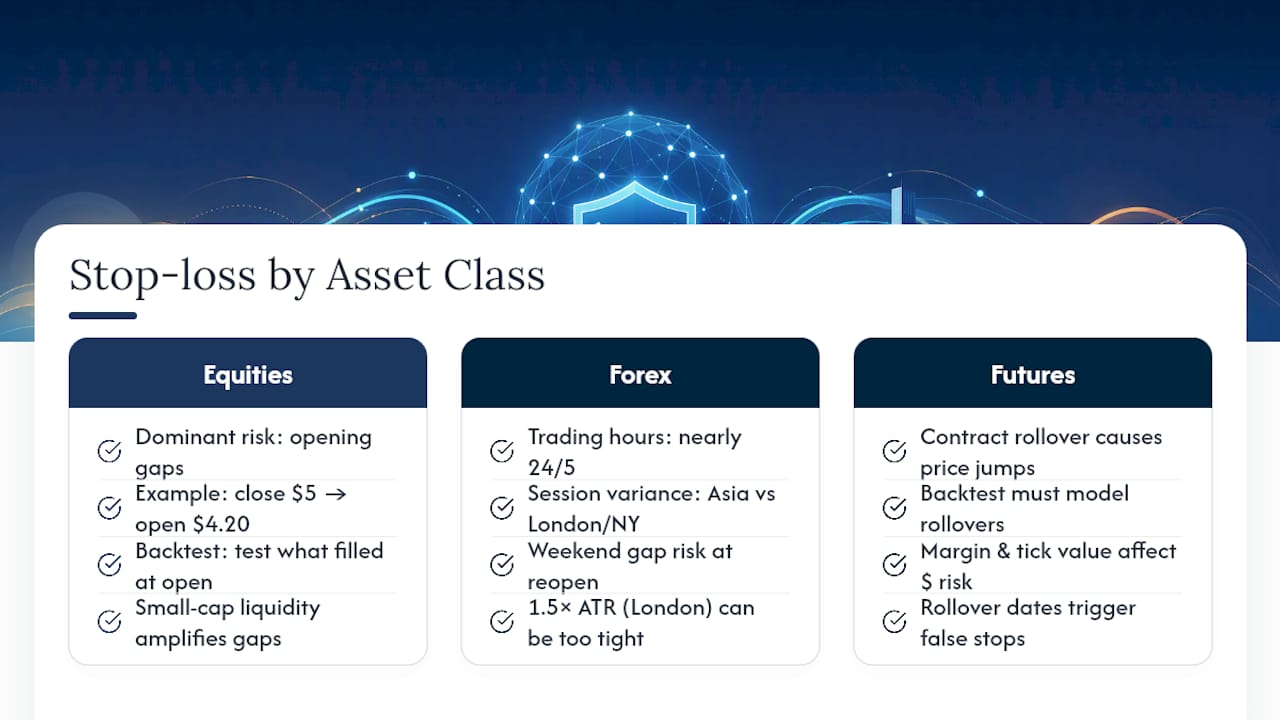
Stop-loss behavior doesn't transfer cleanly across asset classes, because volatility structure, trading hours, and liquidity all differ.
In equities, particularly small-cap stocks, gap risk is the dominant concern. A stock can close at $5.00 and open the next session at $4.20 on bad news, blowing straight through a stop set at $4.80 with no fill in between. Backtesting stop-loss rules on small-caps has to account for these gaps explicitly, testing what actually would have filled at the open rather than assuming the stop price itself.
Forex trading runs nearly 24 hours across a week, so stop-loss backtests need to account for session-based volatility, the Asian session behaves very differently from the London/New York overlap, and for weekend gap risk when markets reopen after a geopolitical event. A 1.5x ATR stop calibrated on London-session volatility can be far too tight during the thinner Asian session.
Futures contracts add contract rollover to the mix. A backtest that ignores the price discontinuity between an expiring contract and the next month's contract will generate false stop triggers right at rollover dates. Futures also carry margin and tick-value considerations that change how a given point-based stop translates into actual dollar risk, something equity and forex traders don't have to model the same way.
Integrating Stop-Loss Rules With Position Sizing and Risk Management
A stop-loss level and a position size are really one decision split into two variables, and testing them separately produces misleading results. The distance from entry to stop determines how many shares or contracts you can buy while keeping your dollar risk constant, so a wider ATR-based stop on a volatile small-cap should come with a smaller position size, not the same size you'd use on a tight fixed stop.
Fixed-fractional position sizing, risking a set percentage of account equity per trade (commonly 0.5% to 2%), is the standard structure for testing this pairing. When you backtest a stop-loss variant, size each trade according to that fixed-fractional rule using the specific stop distance for that variant. Comparing a 2% stop and an 8% stop at identical share counts tells you nothing useful, because the 8% stop carries four times the dollar risk per trade.
Drawdown limits belong in the same test. A stop-loss rule that performs well in isolation can still produce an unacceptable portfolio-level drawdown once you account for correlated positions hitting stops simultaneously during a broad market selloff. Testing stop-loss parameters alongside a maximum portfolio heat rule, a cap on total open risk across all positions, catches this interaction that single-trade backtests miss entirely.
Systematic Methods for Optimizing Stop-Loss Parameters
Grid search is the starting point for most stop-loss optimization: define a range (say, ATR multipliers from 1.0x to 4.0x in 0.25 increments) and test every combination against your entry logic. It's exhaustive, easy to interpret, and computationally cheap for one or two parameters, which is why it remains the default approach even for traders who eventually move to more advanced methods.
Genetic algorithms become useful once you're optimizing three or more interacting parameters, stop distance, time exit, and a volatility filter, for instance, where a grid search would require testing an unwieldy number of combinations. A genetic algorithm evolves a population of parameter sets across generations, keeping the best performers and discarding the rest, converging on strong combinations faster than brute-force search. The tradeoff is a real risk of overfitting to noise if you don't pair it with strict out-of-sample validation, since genetic algorithms are exceptionally good at finding whatever pattern exists in your training data, real or not.
Practitioner guidance consistently emphasizes limiting the number of parameters under test and validating on data the optimizer never saw, precisely because unconstrained searches reliably find impressive-looking noise.
The Practitioner's View on Stop-Loss Testing
Stop losses earn their keep on individual trade risk control. They struggle in whipsaw regimes, where price chops around a level just enough to trigger repeated exits without ever committing to a direction. My rule: limit yourself to two or three parameters per test, and never take a stop-loss variant live without an out-of-sample efficiency check. Skipping that step is how good-looking backtests become disappointing live accounts.
— Romans
Test Your Stop-Loss Variants on Trade-4 Before You Risk Real Capital
This type of platform is built for the workflow described in the article: designing stop-loss variants visually, running them across tick-accurate historical data down to one second, and reviewing per-trade R-multiples and equity curves without managing a local database or writing backtesting code.

If you've been eyeballing stop distances on a chart or running one-off Python scripts without a repeatable process, this is the faster path to an actual answer. Start with a free trial through Trade4's getting-started page, then work through the gap short strategy backtesting guide for a hands-on example that mirrors the fill and intrabar issues covered above. Every stop variant you design gets tested against the same granular data and cost assumptions, so the numbers you see are numbers you can actually act on.
FAQ
Can ChatGPT Backtest a Trading Strategy?
ChatGPT can help you write and debug backtesting code, but it cannot execute a backtest itself. Actual execution requires running that code against real historical data in a programming environment or a dedicated platform like Trade-4.
How Do You Recover From a String of Losing Trades?
There's no shortcut around losses already taken. What helps going forward is reducing position size, revalidating your stop-loss and entry logic with fresh out-of-sample data, and confirming the strategy still passes walk-forward and Monte Carlo checks before resuming full-size trading.
What Is the Best Backtested Trading Strategy?
There's no single best strategy. The strongest candidates are the ones that hold up across walk-forward windows, survive Monte Carlo resampling, and keep a reasonable Deflated Sharpe Ratio after accounting for how many parameter combinations were tested.
Is 100 Trades Enough for Backtesting?
A hundred trades is a reasonable minimum for a preliminary read, but it's a thin sample if concentrated in a single market regime. Treat any stop-loss conclusion drawn from fewer than a few hundred trades spanning multiple market conditions as provisional, not final.