
Profit factor is the ratio of total gross profit to total gross loss on a set of trades, and it tells you whether your winners outweigh your losers. Anything above 1.0 means the strategy made money in your sample. That's the whole verdict, and it's also where most traders stop when they shouldn't. Before you trust the number, compute it net of commissions and slippage, then remove your single biggest winner and recalculate. If the ratio collapses, your edge is an illusion.
TL;DR:
- A profit factor above 1.0 indicates a profitable strategy, but it must be recalculated excluding the largest winner and net of all costs for accuracy.
- An undefined or extremely high profit factor suggests a small sample size or reliance on outliers, not necessarily a true edge.
- A profit factor of 1.6 with a large, diverse sample offers a workable edge, but above 2.0 often signals overfitting or small-test reliance.
- Small sample sizes, outlier dependence, and ignoring costs can falsely inflate profit factor and mislead strategy evaluation.
- Using profit factor alongside other metrics and testing with out-of-sample data ensures a more reliable assessment of trading edge integrity.
Table of Contents
- What Profit Factor Actually Measures
- How to Calculate Profit Factor: A Worked Example
- Reading the Number: What Counts as Good
- Common Pitfalls That Make Profit Factor Lie to You
- Using Profit Factor to Improve and Validate a Strategy
- Tools and Backtesting Practices That Keep Profit Factor Honest
- Why Most Traders Read Profit Factor Backwards
What Profit Factor Actually Measures
The formula is simple: Profit Factor = Total Gross Profit ÷ Absolute Total Gross Loss. Add up every winning trade's dollar gain, add up every losing trade's dollar loss (as a positive number), then divide. There's also a useful alternative form: PF = 1 + (net profit ÷ gross loss), which shows how directly PF is tied to your net result once you already know your losses.
You should calculate this on closed trades only. Open positions with unrealized gains or losses distort the picture, because they haven't proven anything yet. Use dollar figures for a strategy you trade at fixed size, or R-multiples (multiples of your initial risk) when you want to compare setups that risk different amounts per trade. Net-of-costs figures matter more than gross figures here. A strategy that looks solid before fees can turn mediocre once you subtract commissions, spreads, and slippage.
One edge case worth flagging: if your gross loss is zero, meaning you have no losing trades at all, profit factor becomes mathematically undefined or extremely large, which typically indicates an insufficiently large sample. That's not a sign of genius. It's almost always a sign your sample is too small to mean anything.
How to Calculate Profit Factor: A Worked Example
Calculating profit factor by hand takes five steps, and you can run through all of them on a spreadsheet in a few minutes.
- Pick your sample. Choose a defined window, such as the last 100 closed trades or one full quarter, and state it explicitly.
- Sum your winning trades. Add every profitable trade's net gain (after fees) to get gross profit.
- Sum your losing trades. Add every losing trade's net loss (after fees) as an absolute value to get gross loss.
- Divide. Gross profit ÷ gross loss gives you your profit factor.
- Report the context. Note the time window, whether fees are included, and that you used closed trades only.
Here's a dollar example. Say 40 winning trades total $8,000 in gains, and 60 losing trades total $5,000 in losses. Profit factor = 8,000 ÷ 5,000 = 1.6.
Quick Stat: A profit factor of 1.6 means that for every $1 lost, the strategy earned $1.60. That's a workable edge, assuming the sample is long enough and the costs are already netted out.
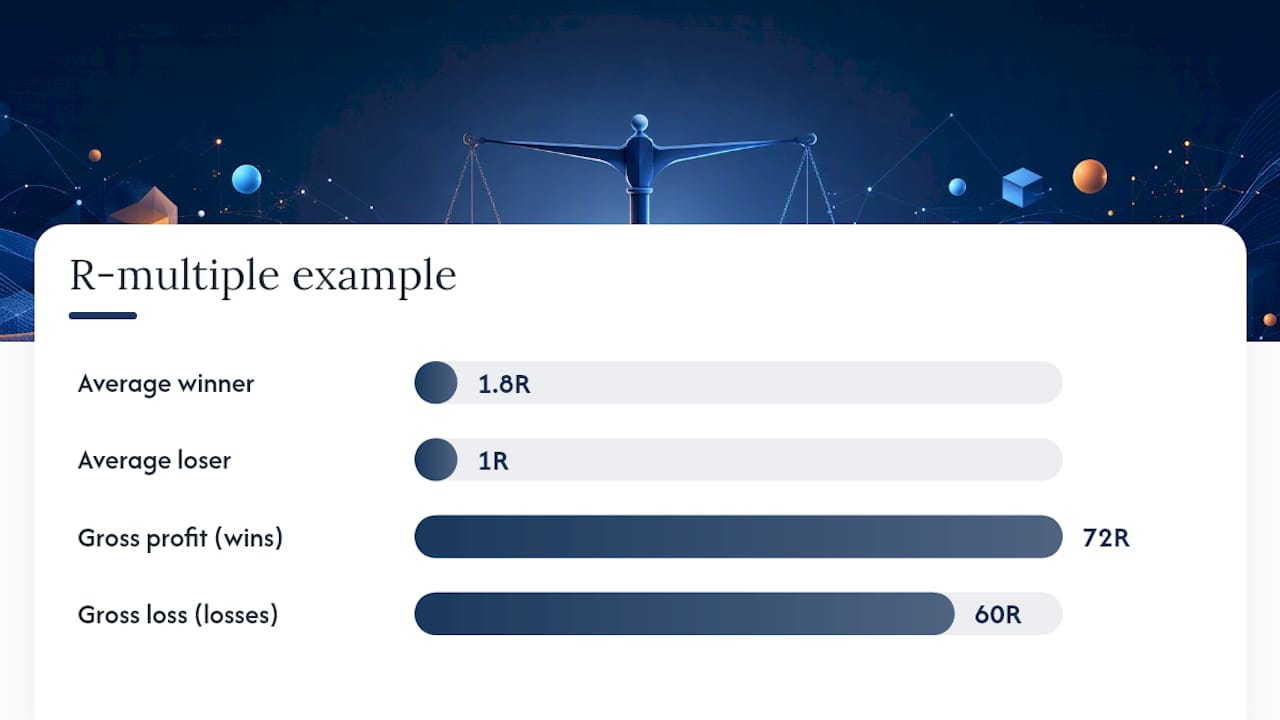
Now the R-multiple version: if your average winner is 1.8R and your average loser is 1R, across 40 wins and 60 losses, gross profit is 72R and gross loss is 60R. PF = 72 ÷ 60 = 1.2. Using R-multiples strips out position-sizing quirks, so you're comparing pure trade quality rather than how much capital you happened to risk.
Reading the Number: What Counts as Good
A raw profit factor means little without context. Rough interpretive ranges look like this:
- Below 1.0: the strategy is losing money, full stop.
- 1.0 to 1.2: marginal, barely covers costs, and easily erased by a bad month.
- 1.2 to 1.5: workable, especially if the sample spans many trades across different market conditions.
- 1.5 to 2.0: strong, but only if the sample covers a sufficiently long period and hasn't been curve-fit to a narrow window.
- Above 2.0: impressive on paper, but treat it as a red flag until you've checked for outlier dependence or an unrealistically small test period.
Quick Stat: Traders often see profit factor above 2.0 collapse toward a lower range once outliers and a fuller sample are accounted for. A number that good, that fast, usually means the test hasn't been stressed yet.
Instrument and timeframe shift what "acceptable" looks like too. A high-frequency small-cap scalping strategy trading dozens of setups a day tolerates a lower PF than a swing strategy holding for days, simply because volume smooths out variance. Profit factor also tells you nothing about magnitude. A strategy with a PF of 1.3 that makes $50,000 a year beats a PF of 3.0 strategy that nets $500. That's why profit factor and expectancy need to be read together, never one without the other.
Common Pitfalls That Make Profit Factor Lie to You
Profit factor rewards a handful of things you don't want it rewarding, and every one of them is checkable.
- Outlier dependence. Run the one-trade test: remove your single largest winning trade and recompute PF. If the ratio drops below roughly 1.2, your entire edge may be riding on one lucky outcome rather than a repeatable pattern.
- Ignoring costs. A PF calculated on gross figures, before commissions, spreads, slippage, and funding costs, will almost always overstate performance. Recompute net of every real cost before you trust the number.
- Small samples. Below 100 trades, treat profit factor as directional, not conclusive. Credibility improves meaningfully once you're working with several hundred trades spanning different market regimes.
- Sizing distortions. A few oversized positions can swing gross profit or gross loss disproportionately. Switching to R-multiples fixes this.
- Silence on drawdown. PF says nothing about how deep or how long your losing streaks run, or how often you trade. Pair it with drawdown and frequency metrics, not just expectancy.
Pro Tip: Before you trust any profit factor above 2.0, ask what happens to it if you delete your three best trades, not just your best one. If it falls apart, you've found a sample that got lucky, not a strategy with an edge.
Using Profit Factor to Improve and Validate a Strategy
Profit factor works best as one gate in a short checklist, not a standalone verdict. Here's how to put it to work.
- Run the three-metric filter. Require a workable profit factor, positive expectancy, and an acceptable risk of ruin before a strategy earns real capital.
- Decompose by condition. Break PF down by setup type, market regime (trending versus choppy), session, and timeframe. A strategy with an overall PF of 1.4 might be hiding a PF of 2.1 in the morning session and 0.8 in the afternoon.
- Test rolling windows. Calculate PF across rolling 3-month or 6-month blocks instead of one lump sample. Consistency across windows matters more than a strong average.
- Require walk-forward stability. A strategy that holds its profit factor on out-of-sample data earns more trust than one optimized to fit history perfectly.
| Check | What it reveals |
|---|---|
| One-trade removal | Whether the edge depends on a single outlier |
| Net-of-costs recalculation | Whether fees erase the apparent edge |
| Rolling-window PF | Whether performance is stable or regime-dependent |
| Walk-forward split | Whether the edge survives outside the training data |
Tools and Backtesting Practices That Keep Profit Factor Honest
The gap between a believable profit factor and a fake one usually comes down to how the backtest was run, not the math itself. Three habits close that gap.
- Net-of-costs, always. Model commissions, spreads, and realistic slippage into every simulated fill, not just the ideal-case entry price.
- Closed trades only. Never mix in open positions when calculating PF for a review or a report.
- Walk-forward and out-of-sample testing. A strategy tuned on one data slice and tested on that same slice will almost always show an inflated PF. Splitting your data and validating out-of-sample exposes curve-fitting fast, a process explained in more depth in a practitioner's guide to walk-forward validation.
A no-code backtester built around exactly these checks lets you test small-cap setups on tick-accurate data down to one-second bars, apply granular entry and exit filters, and run same-day re-entry analytics that expose whether your PF depends on a handful of lucky re-entries. For a full walkthrough of setting up a test and reading the resulting metrics, the step-by-step backtesting guide covers the process from data selection to output review, and a broader backtesting checklist from FundedAxe offers a useful second opinion on the pitfalls to watch for before committing capital.
Why Most Traders Read Profit Factor Backwards
The conventional advice treats profit factor like a scoreboard: higher is better, full stop. That's backwards. A profit factor of 4.0 built on 30 trades tells you almost nothing, while a profit factor of 1.3 built on 800 trades across three market regimes tells you a great deal. Sample size and cost realism matter more than the headline number itself, and most retail traders skip both.
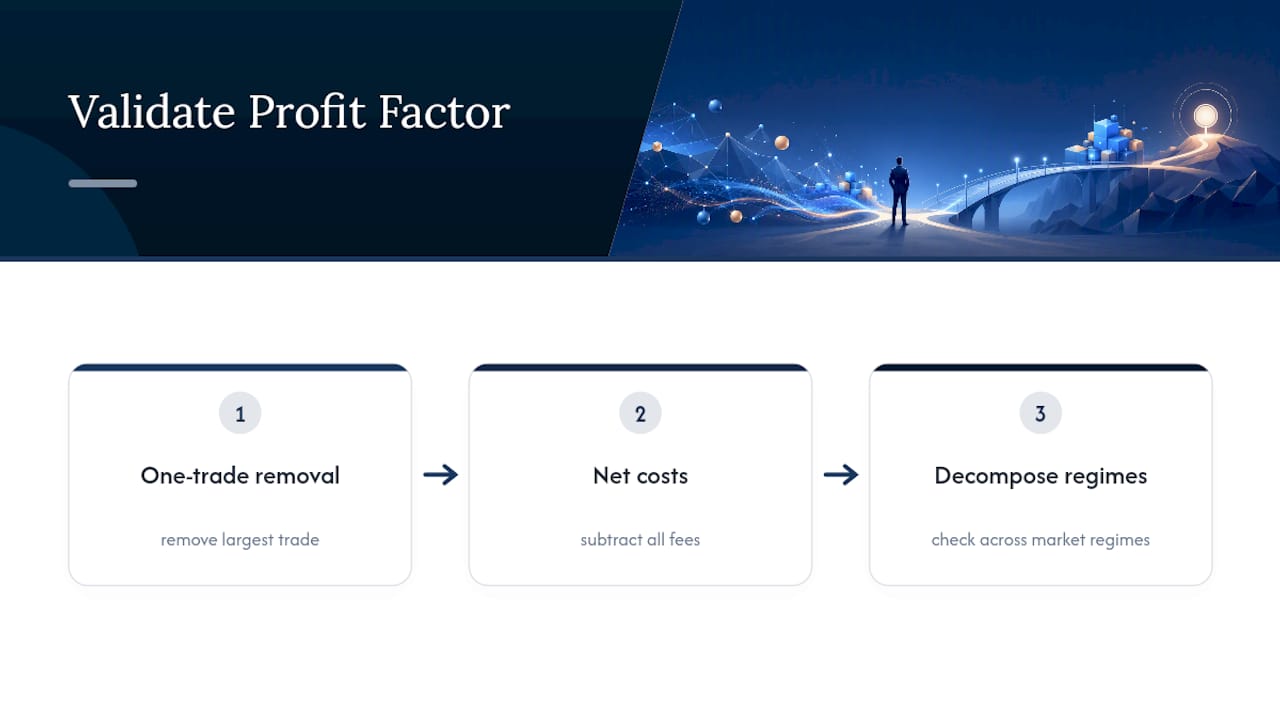
The biggest blind spot isn't the math. It's the sequencing. Traders calculate PF first and stress-test it never. Flip that order. Run the one-trade removal test before you get attached to a number, net out every cost before you celebrate, and decompose performance by regime before you assume it will hold in the next one. A strategy that survives all three checks and still clears 1.3 or 1.4 is worth more than one that shows 2.5 on a raw, untested sample.
Profit factor is a gate, not a grade. Treat it that way, and it'll actually tell you something true.
— Romans
This article is general information, not a substitute for advice from a qualified financial advisor. Consult a qualified financial professional about your own circumstances before acting on anything here.