
Yes, you can backtest low-float strategies reliably, but only if you combine realistic execution modeling with statistical robustness checks. Skip either half and you'll build a system that looked profitable on paper and folds within a week of live trading. The single highest-priority guardrail: model slippage, borrow, and liquidity scaling honestly, then validate the result with walk-forward testing plus PBO or deflated Sharpe before you trust a single equity curve.
TL;DR:
- Backtesting low-float strategies requires realistic modeling of slippage, borrow costs, and liquidity scaling to avoid overestimating profitability.
- Market mechanics such as short squeezes and pump-and-dump cycles dominate low-float price action and must be incorporated into backtest assumptions.
- Validation methods like walk-forward testing, PBO, deflated Sharpe ratio, and Monte Carlo simulations are essential to distinguish genuine edges from overfitting.
- Conservative execution scenarios and liquidity adjustments often reduce perceived strategy performance by at least 50 percent, highlighting the importance of realistic fill assumptions.
- Low-float backtests demand smaller sample sizes and higher scrutiny, making thorough validation and realistic impact modeling critical for live trading confidence.
Table of Contents
- What Low Float Means and Why It Changes the Math
- Common Pitfalls That Make Low Float Backtests Misleading
- The Validation Toolkit: What Each Method Actually Catches
- Execution Realism and the Liquidity Deflator Problem
- A Practical Checklist for a Defensible Backtest
- How Trade4 Speeds Up Defensible Low Float Research
- Adjusting Backtests for Limited Liquidity and Market Impact
- What Low Float Backtest Results Actually Look Like
- Low Float Versus High Float: A Different Backtesting Problem Entirely
- Romans' Perspective: What Testing Actually Teaches You
- Get Started With a Purpose-Built Platform Today
- Further Reading and Sources
What Low Float Means and Why It Changes the Math
Float is the number of shares actually available to trade, not the total shares outstanding. A company can show 200 million shares on its balance sheet while only 8 million trade freely, with the rest locked up by insiders, funds, or recent issuance restrictions. That gap matters more than most backtests admit.
Below roughly 50 million shares of float, the order book starts thinning out noticeably. Under 10 to 20 million, the float itself often becomes the dominant force behind price action, more influential than earnings, news, or sector trends. A handful of aggressive buyers can move a stock 40% in an afternoon simply because there isn't enough supply to absorb the demand.
This mechanic explains why low-float names cluster around a few recurring risk patterns:
- Short squeezes, where thin supply and heavy short interest collide during a rally.
- Pump-and-dump cycles, where coordinated buying inflates price on artificially light volume.
- Gamma squeezes, where options market makers chase delta hedges into an already illiquid stock.
- Lockup and IPO supply shocks, where float can double overnight once insider shares become tradable.
Any backtest that ignores these mechanics is really testing a fantasy version of the stock, one with a deep order book that never existed.
Common Pitfalls That Make Low Float Backtests Misleading
Most low-float backtests fail quietly. The equity curve looks fine, the drawdown looks tame, and the Sharpe ratio looks respectable. The problem shows up only after you understand what the backtest secretly assumed.
- Flat liquidity filters that shrink the historical universe. A fixed dollar-volume threshold applied across a five-year window quietly excludes different stocks in 2021 than it would in 2026, introducing survivorship bias that inflates returns without you noticing.
- Lookahead contamination through the data itself. Deflating or adjusting volume series at the source, rather than adjusting the eligibility threshold, corrupts the very numbers you use to estimate fills and slippage.
- Ignoring borrow availability. Many low-float short setups look great in a backtest that assumes shares were always borrowable at a flat fee. In reality, borrow can vanish entirely on the names that matter most, or cost 200% annualized overnight.
- Unchecked parameter sweeps. Running hundreds of variations of entry gap percentage or volume threshold until one combination produces a beautiful curve is not strategy development. It's overfitting with extra steps, and it's the single biggest reason backtest Sharpe and live Sharpe show almost no correlation across published retail strategies.
The Validation Toolkit: What Each Method Actually Catches
Every one of these methods exists to answer one question: is this edge real, or did you just get lucky sorting through enough parameter combinations? Each catches a different failure mode, and skipping one leaves a blind spot the others won't cover.
- Walk-forward validation splits your history into sequential in-sample and out-of-sample windows, either anchored (expanding) or rolling (fixed length). For thin, choppy low-float names, this matters more than almost anywhere else in trading, because a strategy that fit 2023's meme-stock behavior often falls apart against 2025's tighter volatility regime.
- Monte Carlo and bootstrap resampling build confidence bands around your returns and Sharpe ratio instead of trusting a single historical path. Low-float returns are highly autocorrelated (a big move today often predicts another tomorrow), so block or centered bootstraps that preserve that serial structure produce far more honest confidence intervals than naive resampling.
- PBO (probability of backtest overfitting) quantifies how likely it is that your best-performing variant only looks best because you tried many. Jittering your parameters within a realistic range, roughly ±20%, and recomputing PBO across the resulting return matrix gives you a concrete number: near 0.5 suggests chance-level performance, while values pushing higher point toward genuine overfitting.
- Deflated Sharpe ratio (DSR) corrects your Sharpe estimate for the number of trials you ran, the same logic behind multiple-testing correction in statistics. A Sharpe of 1.8 after testing three variants means something very different from a Sharpe of 1.8 after testing three hundred.
A practical pipeline runs in sequence: raw backtest, then walk-forward, then PBO and DSR, then Monte Carlo stress tests, recording a pass or fail verdict at each gate rather than only at the end.
Pro Tip: Treat each validation gate as a veto, not a vote. If your strategy fails PBO but passes walk-forward, it still fails. A strategy only earns trust after clearing every gate, not most of them.
Execution Realism and the Liquidity Deflator Problem
A backtest is only as honest as its fill assumptions. Run three execution scenarios side by side: an optimistic case using tight spreads and full fills, a base case using realistic slippage drawn from your own historical spread data, and a conservative case assuming partial fills and wider slippage during the fastest moves. If your strategy only survives the optimistic scenario, it isn't ready for live capital.
Borrow deserves its own gate entirely for short strategies. Model borrow cost as a variable, not a constant, and flag days when borrow simply wasn't available, because those are exactly the days a squeeze-prone low-float name tends to run hardest.
The subtler issue is liquidity scaling. A flat dollar-volume threshold applied across a multi-year backtest window creates a structural bias, since $2 million in daily volume meant something very different in 2019 than it does now.
- Scale the eligibility floor over time using a broad-market reference, such as the S&P 500's 200-day moving average, applied to the threshold itself.
- Never scale the raw volume or price data your fill and slippage models depend on, only the gate that decides which stocks qualify.
- Precompute that reference series once for the entire universe to keep the approach reproducible and avoid asset-by-asset drift.
This "SPX liquidity deflator" approach still carries a small residual look-ahead risk depending on which reference point you anchor to, so document your anchoring choice and test sensitivity around it rather than treating it as a solved problem.
A Practical Checklist for a Defensible Backtest
Run this sequence in order. Skipping steps is how a strategy that looked bulletproof in testing ends up bleeding capital in month one.
- Data: Use the highest bar granularity your platform supports, ideally 1-minute or tick-level, and retain full float history, corporate actions, and news tags alongside price data.
- Universe: Apply a scaled liquidity threshold rather than a flat one, and explicitly flag lockup expirations and new issuance events that change float mid-history.
- Execution: Run optimistic, base, and conservative fill scenarios, and attach a borrow cost model to any short-side logic.
- Robustness: Freeze your parameters, then run walk-forward, PBO, DSR, and Monte Carlo stress tests in sequence, keeping an audit trail of every run.
- Decision rules: Set pass or fail thresholds in advance, for example requiring PBO under 0.3 and positive expectancy across every walk-forward window, rather than deciding after seeing the results.
Pro Tip: Write your pass or fail thresholds down before you see a single result. Deciding "good enough" after the fact is exactly how overfitting sneaks back in through the front door.
How Trade4 Speeds Up Defensible Low Float Research
Every step above takes real time to build from scratch, which is exactly the gap a purpose-built platform closes. A visual pattern builder lets you configure entry, exit, and risk filters without writing custom code, and historical data running from 1-minute bars down to 1-second granularity, fine enough to model the fast fills that low-float setups depend on.
News tagging can flag catalyst-driven moves directly inside trade results, helping separate a genuine edge from a lucky earnings gap. Same-day re-entry analytics can show whether a strategy performs differently on a second entry after an initial stop-out, a pattern common in low-float runners that many backtesters ignore. Multi-strategy runs and bucketed performance analysis allow testing optimistic, base, and conservative execution scenarios side by side rather than one at a time.
- No-code visual strategy and pattern builders
- Tick-to-1-second historical data depth
- News tagging and catalyst analysis
- Same-day re-entry analytics
- Multi-scenario, multi-strategy test runs with bucketed performance metrics
Detailed setup walkthroughs, including how to backtest gap short strategies on small caps, live on the Trade4 blog for readers who want worked examples.
Adjusting Backtests for Limited Liquidity and Market Impact
Standard backtesting assumes your order doesn't move the market. On a stock with 5 million shares of float, that assumption breaks almost immediately. A few practical adjustments close most of the gap.
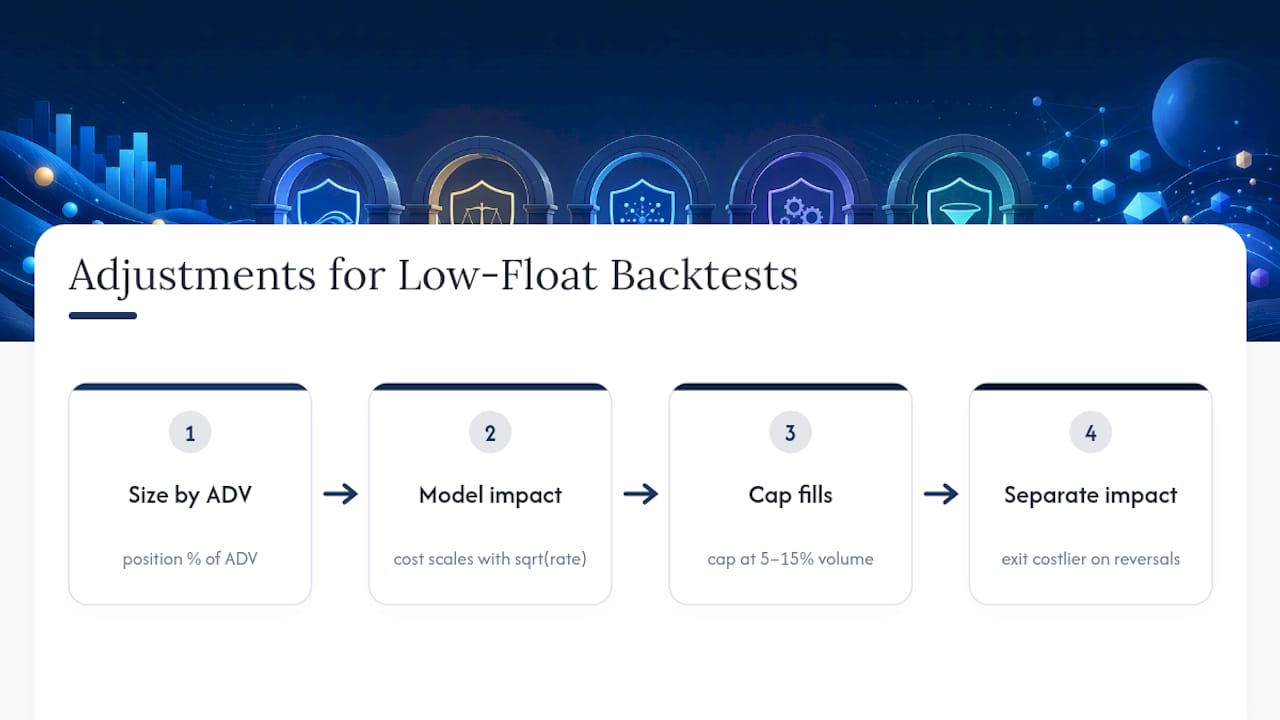
First, size positions as a percentage of average daily volume rather than a fixed dollar amount. A $50,000 position in a stock trading $2 million a day behaves nothing like the same position in a stock trading $200,000 a day, and a flat position size across your entire universe hides that difference completely.
Second, model impact as a function of your own order size relative to available volume, not a flat basis-point assumption. A simple square-root impact model, where cost scales with the square root of your participation rate, captures the nonlinear reality of thin books better than a linear slippage estimate.
Third, cap your simulated fill at a realistic fraction of the bar's volume, often somewhere between 5% and 15% depending on the name, rather than assuming you can execute your full size at the printed price. This single adjustment alone tends to knock the most inflated backtests back down to something closer to reality.
Finally, separate your entry and exit impact assumptions. Exiting a losing low-float position during a fast reversal often costs far more in slippage than entering did, since you're now selling into a book that other traders are also racing to exit.
What Low Float Backtest Results Actually Look Like
Consider a gap-and-go long strategy tested on stocks under 20 million float with a 20% overnight gap trigger. Run naively with flat fills, the raw backtest might show a Sharpe ratio north of 2.5 and a smooth equity curve. Once you apply the conservative execution scenario and cap fills at a realistic volume percentage, that Sharpe often drops by half or more. That drop isn't a bug. It's the backtest finally reflecting what a real fill would have cost.
A second common pattern shows up in short strategies targeting overextended low-float runners. The raw backtest, ignoring borrow, might show consistent profitability. Once you overlay actual borrow cost variance and mark days when shares simply weren't available to short, a meaningful share of the best-looking trades disappear from the eligible set entirely, because you couldn't have taken them.
The interpretation matters more than the numbers themselves. A strategy that survives conservative execution assumptions and passes walk-forward across multiple regimes, even at a lower Sharpe than the optimistic version, is far more trustworthy than one that only shines under the friction-free assumptions most beginners default to. Traders reviewing their own low-float backtest results should treat any dramatic gap between optimistic and conservative scenarios as a warning sign about the strategy's actual live viability, not a detail to average away.
Low Float Versus High Float: A Different Backtesting Problem Entirely
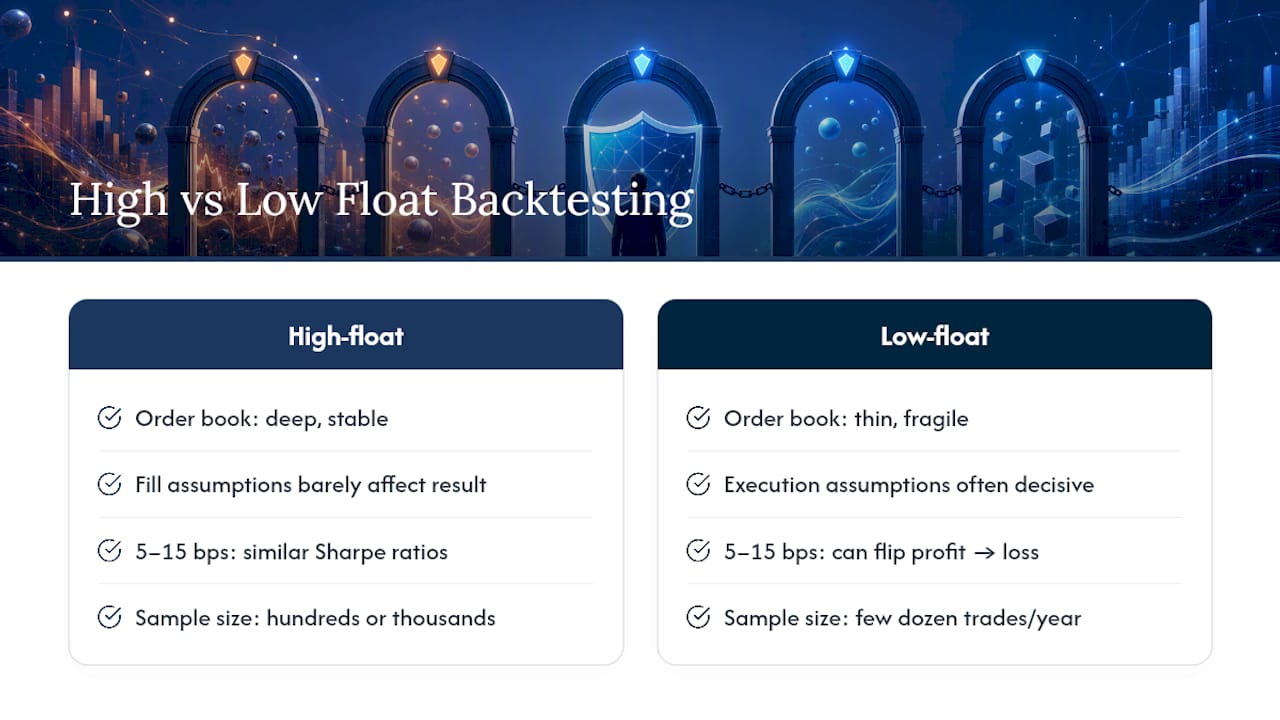
Backtesting a high-float, large-cap strategy and backtesting a low-float strategy are two different disciplines that happen to share the same software. High-float names, think S&P 500 constituents, tend to have deep, stable order books, so a backtest's fill assumptions barely affect the result. Slippage might shave a few basis points off returns; it rarely changes the strategy's viability.
Low-float backtesting flips that relationship. Execution assumptions often account for the majority of the difference between a strategy that looks profitable and one that's actually tradable. A high-float momentum strategy might show similar Sharpe ratios whether you model 5 basis points or 15 basis points of slippage. A low-float strategy can swing from strongly profitable to unprofitable across that same range.
Sample sizes diverge too. High-float strategies typically have hundreds or thousands of qualifying setups across a multi-year window, giving walk-forward and Monte Carlo methods plenty of data to work with. Low-float setups, especially ones filtered by tight float and volume criteria, might produce only a few dozen qualifying trades per year, which means PBO and deflated Sharpe corrections matter even more since thin sample sizes are exactly where overfitting hides best.
Romans' Perspective: What Testing Actually Teaches You
The early false positives are always the same story: a strategy nails a handful of legendary runners, and the curve looks unbeatable until you widen the sample. Sudden float changes, a lockup expiring, a secondary offering, flip a stock's entire risk profile overnight, and no amount of historical fitting prepares you for that. Conservative execution scenarios catch fragile edges because they force the strategy to survive friction it was never built to handle. Know when to walk away: if a setup only clears every gate after your third round of "small adjustments," that's not refinement, that's overfitting wearing a disguise.
— Romans
Get Started With a Purpose-Built Platform Today
The checklist above, from data granularity through borrow modeling to walk-forward validation, is a lot to build from scratch. A no-code platform can run tick-to-1-second historical data, with built-in optimistic, base, and conservative scenario modes, news tagging, and same-day re-entry analytics, all without setting up a local database or writing a single query.

If you've been running low-float ideas through spreadsheets or generic backtesting scripts, the Trade4 Backtester gives you a faster, more disciplined path to the same conclusions. Start with the getting-started guide to walk through your first no-code strategy build, or browse the Trade4 blog for worked examples on small-cap and low-float setups before you run your own.
Further Reading and Sources
For deeper technical grounding, review guides on walk-forward validation and penny stock backtesting fundamentals, along with the general step-by-step backtesting workflow referenced throughout this guide.